
The Canari American marriage pattern
Yes, even marriage patterns are different in Canari America.

It’s been a while since I posted anything about Canari America, the region of Latin America heavily settled by migrants from the Spain’s Canary Islands. To refresh your memory: I’ve published several posts arguing that Canarian immigrants had a disproportionately large demographic impact in Latin America and this sizable population flow, concentrated in a few Latin American regions, significantly shaped the culture of those regions.
To get a sense of which Latin American countries and regions are encompassed in Canari America, here’s a map showing the main migration routes from the archipelago to Latin America taken from my old August 2024 post:
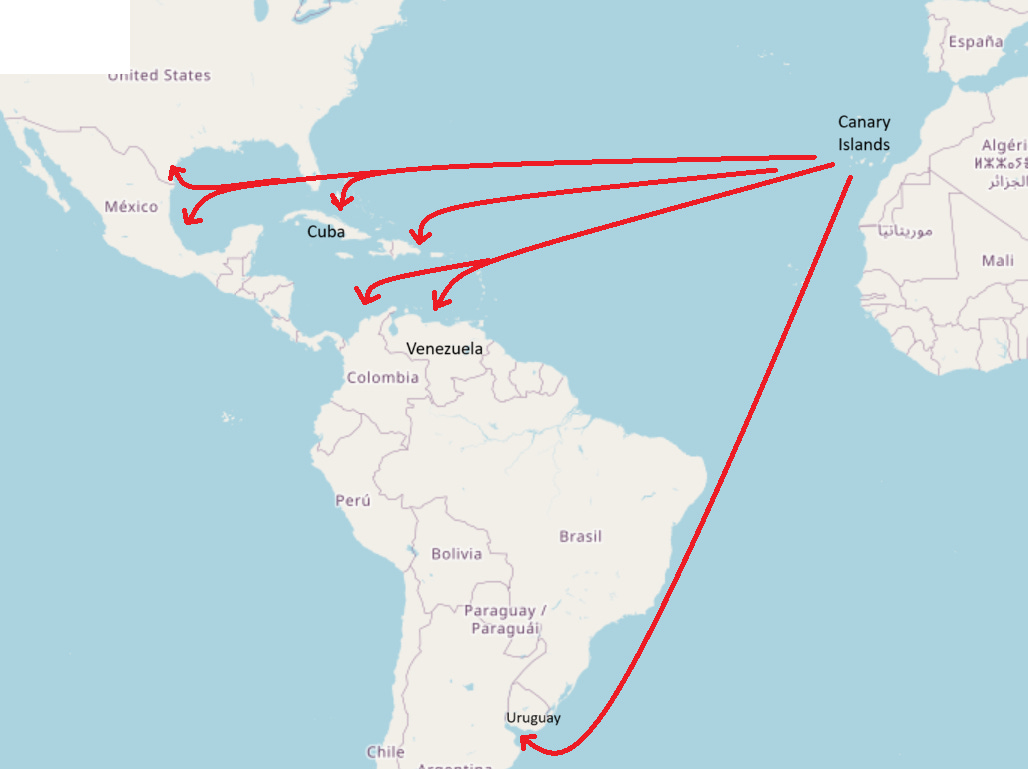
As you can see on the map, most areas colonized by Canarian immigrants are located in the Caribbean. Some of these settlement areas are easily recognizable as modern Latin American countries, like Cuba and Uruguay, while others correspond to certain areas within countries, such as Colombia’s Caribbean coast or Venezuela’s Caribbean region (home to the majority of the country’s population).
The cases where certain regions within a country were settled by Canarians while others were not are particularly interesting, allowing us to compare Canarian vs non-Canarian political culture, religious culture, etc, within the same country, free1 from confounding factors that might affect cross-country comparisons.
This is what I did in August 2024, comparing the voting patterns of Colombia’s Canarian-settled region, as a proxy for its political culture, to those of Colombia’s (non-Canarian) Andean region. That analysis, and a similar comparison between the Canarian and non-Canarian (Andean) regions of Venezuela, led me to conclude that areas colonized by Canarian Islanders exhibit distinct voting patterns compared to regions colonized by other Spaniards2.
So, does my hypothesis that Venezuelan regional voting patterns, and other cultural differences, derive from the cultural differences between Canarian settlers (a major component of the colonization of the Caribbean coast) and those from other Spanish regions hold up when applied to the case of Colombia?
…Colombia mirrors Venezuela in that its Caribbean and Andean regions exhibit distinct voting patterns….Historically, in most Colombian elections, the Caribbean region has shown a stronger preference for the left-wing candidate (typically the Liberal party candidate) than the Andean region, mirroring the electoral trends for Venezuela.
I also compared religious culture across countries and found a consistent pattern of lower religiosity in Latin American regions with more Canarian influence3, mirroring the lower religiosity of the Canary Islands compared to the rest of Spain.
So, dividing Colombia into a Caribbean and a non-Caribbean region seems to corroborate the relationship between Canarian influence and lower religiosity. While applying the same division to Venezuela, although it doesn’t contradict the premise, does not provide such a strong support for the relationship.
Regardless of whether you agree with my view that the CPP ratio is a reliable indicator of religiosity, the fact stands that it captures a core feature distinguishing the various Catholic cultures within Latin America. A feature that is consistent over time, and correlates very strongly with Canarian influence and culture.
These are only two of the several (many?) cultural facets in which Canari America differs from the rest of Latin America, usually mirroring cultural differences between the Canari Islands and mainland Spain. I’ve been intending to write about other cultural aspects where Canarians significantly differ from other Spaniards for quite some time - but other topics got in the way4. Then, as luck would have it, I stumbled upon an X post mentioning the exceptionally high rate of cohabiting unions in Latin America.
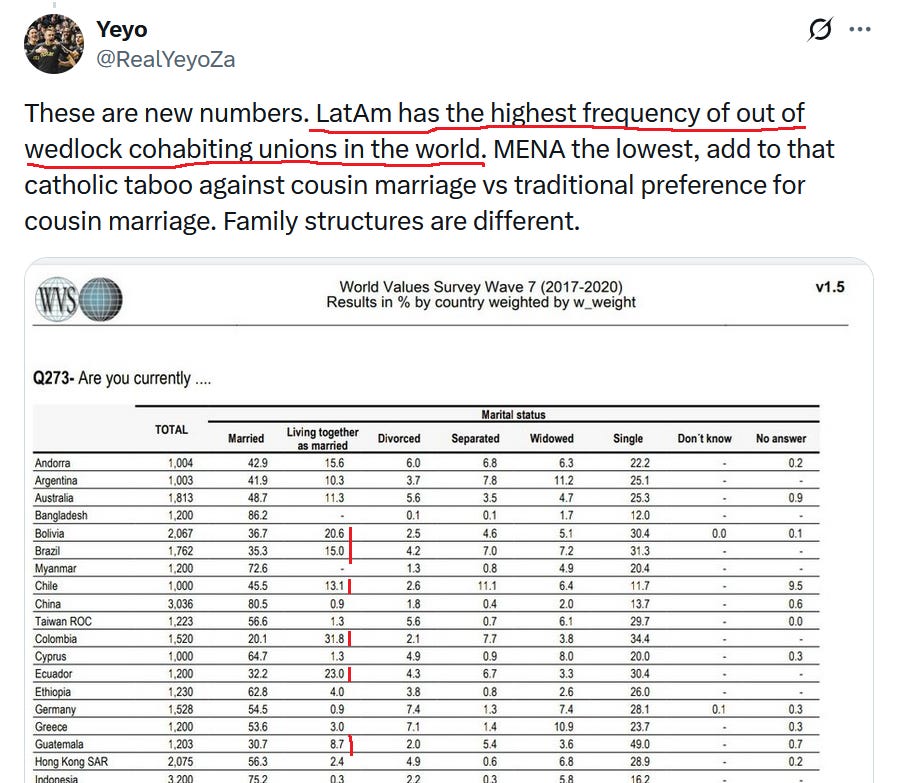
After reading Yeyo’s tweet I thought to myself, “maybe I should take a moment to research this and see if I find anything interesting“. Next thing I knew, I was diving into the World Values Survey data - the source for the cohabitation rates in the table above - trying to replicate the figures for each Latin American country.
The World Values Survey (WVS) conducts its surveys in waves, each spanning several years during which samples of residents from many countries will be polled using the same questionnaire. The last wave - number seven, referenced in the tweet above - took place from 2017 to 2022 and is the main data for this post.
I had never examined data from the World Values Survey (WVS) before5, but I soon realized it’s very easy to work with, and since I’m only interested in one of the many questions asked by the survey, Are you currently living together as married?, made the process even simpler6.

The table above doesn’t show the rate of cohabitation for each and every Latin American country included in the WVS data7, so my first task was to calculate the rates for all available countries. Here it is:
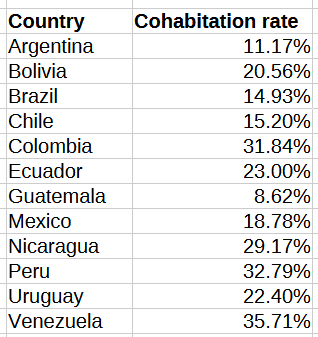
I’m not going to show you how these results look on a map just yet. First, I want to address the issue of how different population structures affect the percentages of cohabiting survey respondents. Consider Guatemala, which has the second youngest population in Latin America and also the lowest cohabitation rate (8.62%). A younger country may have more single individuals8, making the rate of all non-single categories (married, cohabiting, etc.) seem lower than that of an older country, even though its people are no less inclined to marry or cohabitate.
I can avoid this distorting effect by calculating a ratio of cohabiting respondents to married respondents, thus quantifying the propensity to cohabitate only among those who are in a stable relationship. And after calculating this ratio, Guatemala’s aversion to cohabitate - relative to the rest of Latin America - appears less exceptional, with a ratio of 0.282 compared to Argentina’s 0.287.
And now that we have a more robust index, more closely linked to couples’ propensity to cohabitate, let’s take a look at a colored map of Latin America, showing cohabitation ratios for all twelve countries with available data.
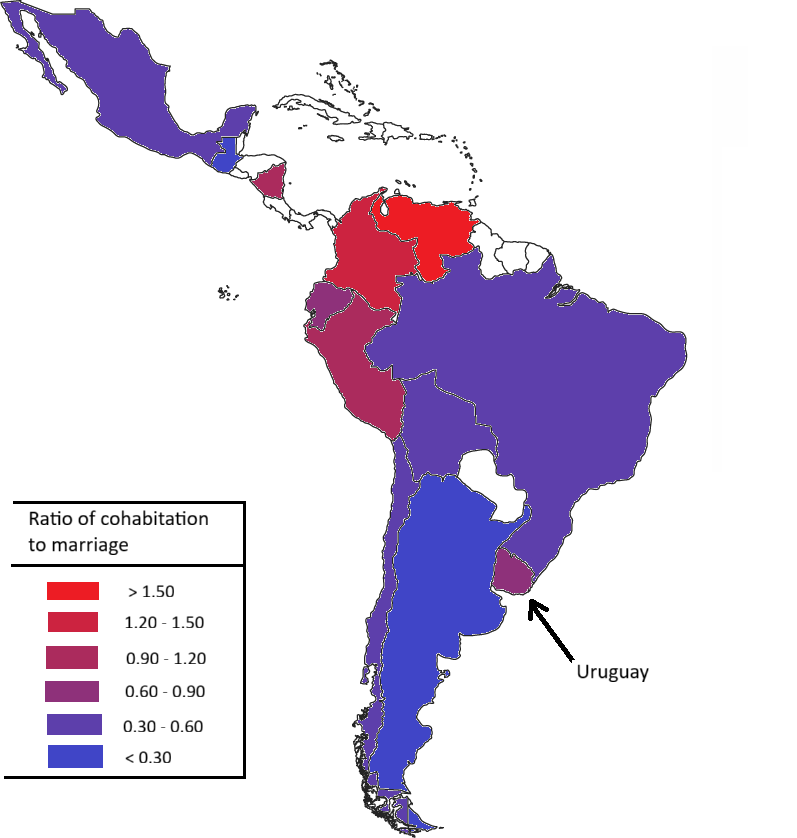
Colombia and Venezuela have the highest ratios by far (1.58 and 2.06), with many more individuals cohabiting than married, but Peru and Nicaragua also have fairly high cohabitation ratios. Also notice that Uruguay does not look very reddish on the map, but its ratio is rather high (0.889, fifth highest) compared to its neighbors.
My hypothesis is, of course, that these results follow a pattern of higher cohabitation ratios in countries with greater Canarian influence, with Peru and Nicaragua as notable exceptions to this rule. I know the data I’ve presented so far is too sparse to confirm this hypothesis, but for now please note that’s what I’m aiming for.
Uruguay is a bit of an anomaly among Canari American countries as the only nation outside the Caribbean basin which received a large flow of Canarian immigrants, challenging the apparent climatic connection between the semi-tropical Canarian archipelago on one side of the Atlantic and the tropical sea on the other side of the ocean. That is why I feel compelled to highlight aspects of Uruguayan culture that may show Canarian influence, or at least appear more Canarian than those of the average Latin American country. If these deviations from the Latin American norm were confined to Canarian regions around the Caribbean, one might be tempted to ascribe them to “Caribbean culture” as the most straightforward explanation for this pattern9. Uruguay provides strong evidence that this explanation is wrong.
Perhaps “Strong” sounds like a strong word when based solely on the colored map above. Uruguay appears only a shade redder than Brazil, so at first glance it doesn’t look very exceptional among Southern Cone countries. But this first impression results from both the color scale I (naively) chose and the substantial variation in cohabitation ratios among Brazilian states.
Let me try another colored map, but this time showing subnational entities and using a color scale representing values from 0.20 to 0.90.
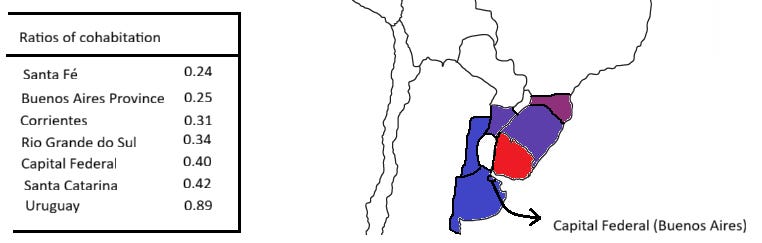
Now that’s very red. As you can see in the left side legend of the map, Uruguay’s cohabitation ratio is almost triple that of most neighboring subnational entities10, exposing its distinctiveness within the River Plate basin of South America.
Zooming in on Colombia and Venezuela
Given the insights we gained by zooming in on Uruguay and its neighbors, revealing the distinct Uruguayan marriage pattern, perhaps we should now shift our focus to Colombia and Venezuela, the two countries with the highest cohabitation ratios according to WVS data.
The idea is to compare Andean against Caribbean regions of both Colombia and Venezuela, just like I previously did when analyzing political culture and religious culture in Latin America. The WVS collects data from most Colombian departments and Venezuelan states, though in some cases the samples are too small (10 or 20 respondents) to produce reliable results. To avoid this pitfall, I grouped together Colombian departments by region, Andean and Caribbean, and calculated a cohabitation to marriage ratio for each. Then I repeated this process with Venezuela’s states to obtain a ratio for its Andean and Caribbean regions.
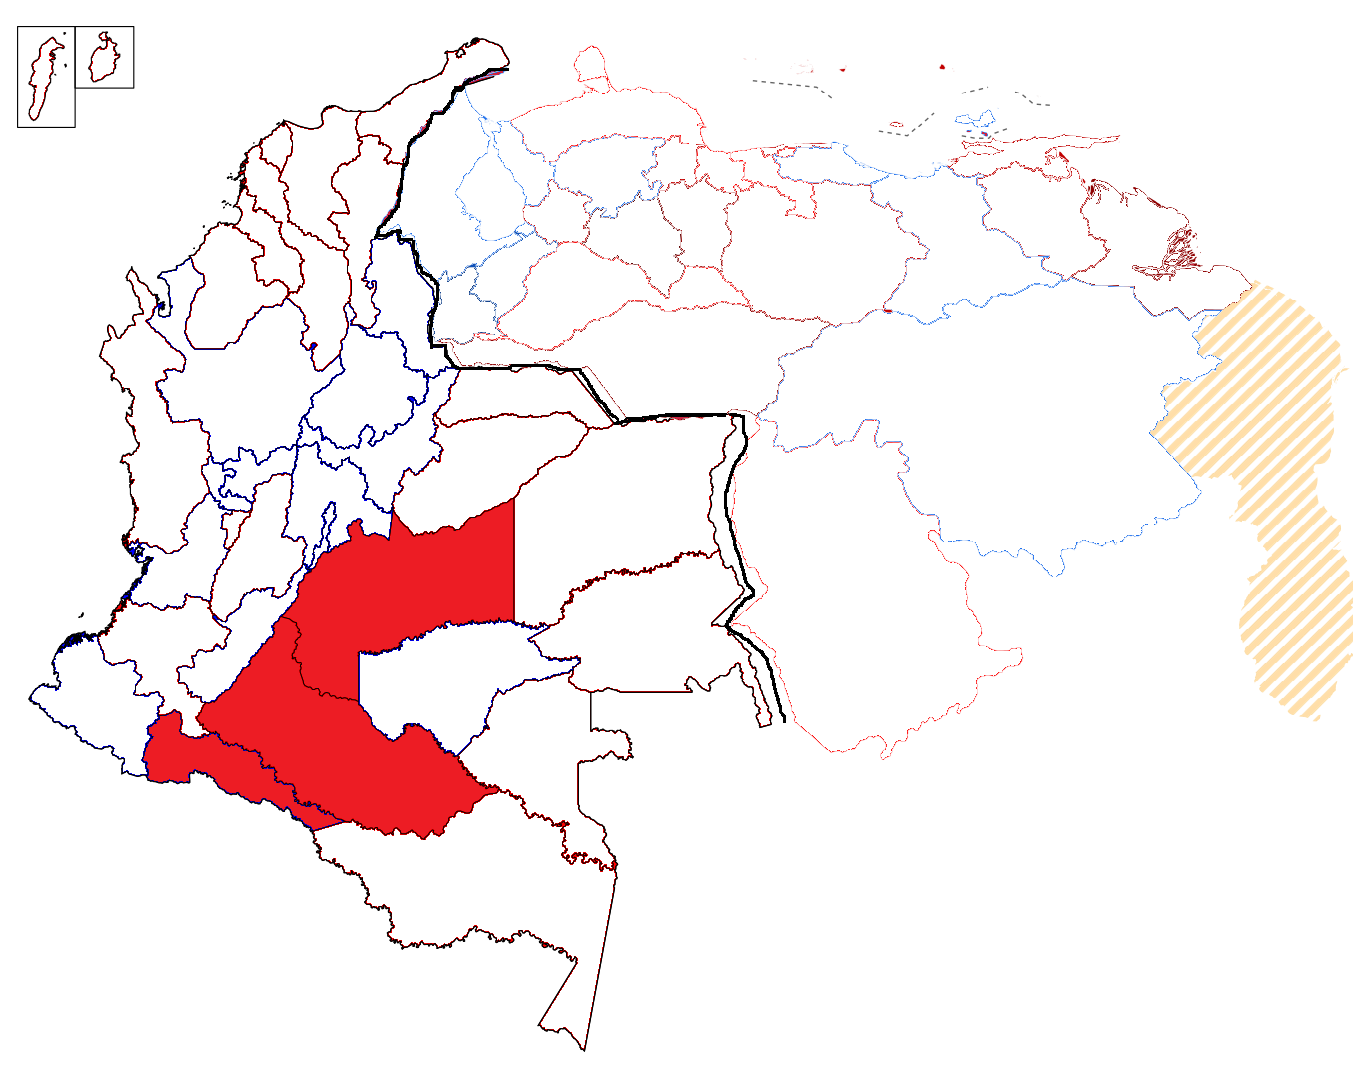
And here are the results, displayed in a colored map as usual.
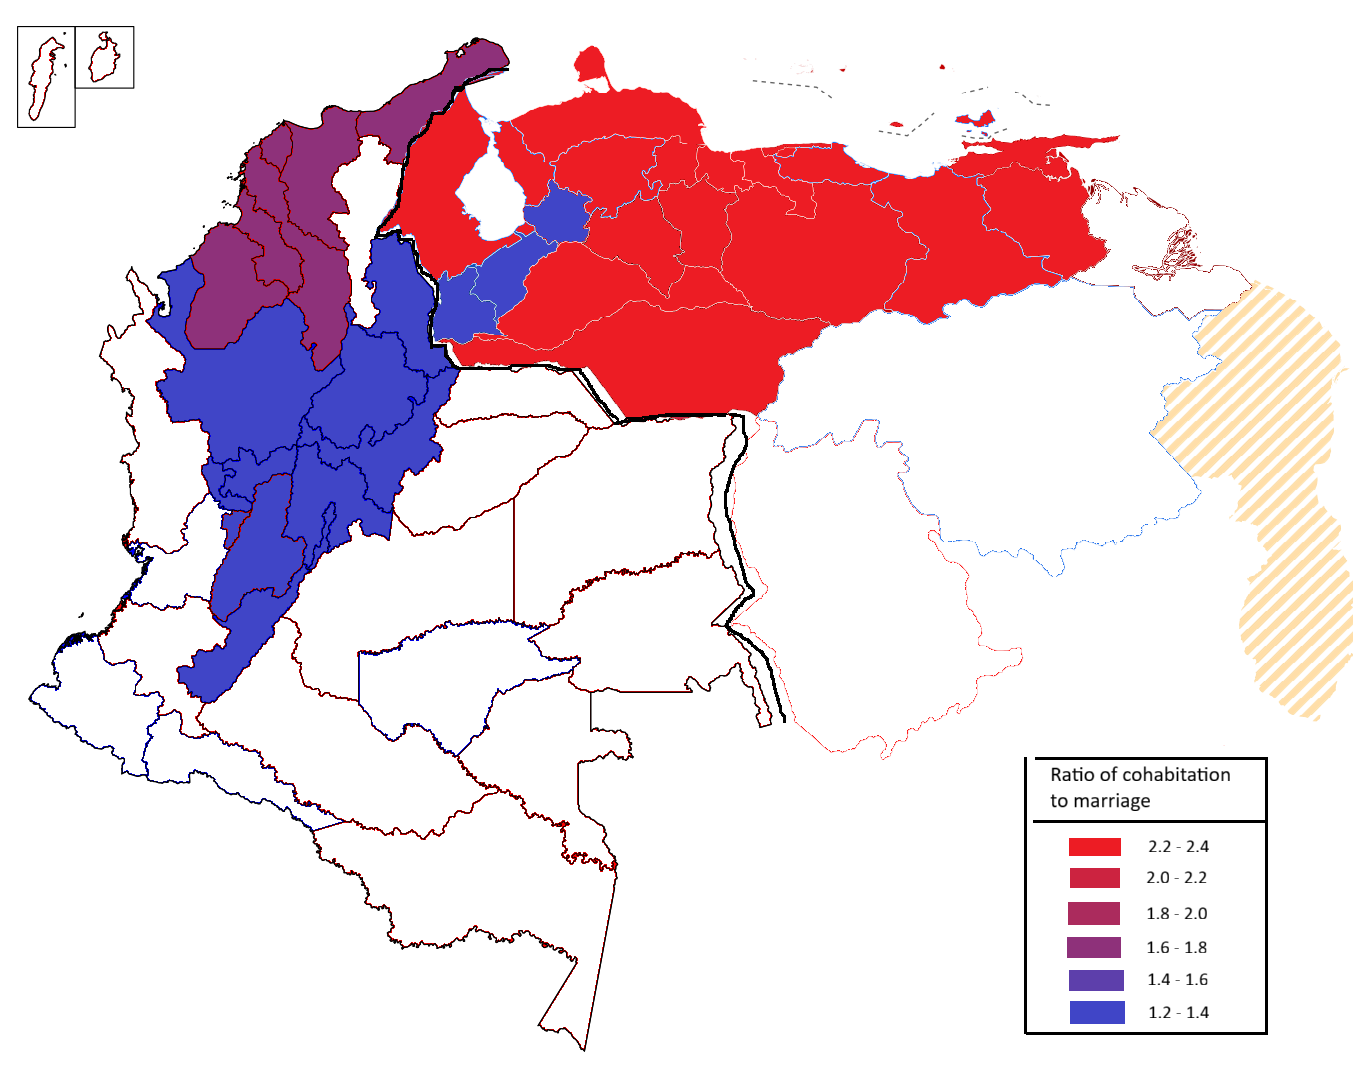
The deep reddish tone of Venezuela’s Caribbean region clearly indicates its high cohabitation ratio, yet its striking prominence - compared to the milder purple of the Colombian Caribbean - suggests there might be administrative or legal factors, related to Venezuela’s bureaucracy or legal system, which cause the high ratio.
These hypothetical non-cultural factors might be raising Venezuela’s ratio or conversely lowering Colombia’s, but I’m skeptical of such non-cultural explanations because:
Venezuela looks very red on the map, but not entirely so. The country’s Andean region, home to roughly 10% of the population, has a substantially lower cohabitation to marriage ratio (1.24), despite sharing the same legal system as the rest of the country.
Colombia appears mostly blue on the map, but that is largely because I chose to focus on its Caribbean and Andean regions while leaving the rest of the map blank. However, Colombia’s eastern half seems to have a very high cohabitation ratio11, perhaps higher than Venezuela’s, despite sharing the same legal system as the rest of the country.
In brief, the most plausible explanation I can think of for the marriage patterns in Colombia and Venezuela, characterized by significantly higher cohabitation in Caribbean regions than in Andean regions, appears to be cultural. And one plausible origin for this cultural disparity is the high level of Canarian settlement in the Caribbean regions of both countries.
But why would Canarian settlement lead to this particular marriage pattern? Correlation does not imply causation. The high cohabitation ratios in regions with greater Canarian settlement doesn’t mean the latter causes the former.
To answer that question we must look at the source. The source of Canarian migration that is.
Use the source
If a deep cultural divide exists between Canarians and mainland Spaniards, so deep in time that those (mostly) descended from Canarians who migrated to the Americas centuries ago still show the effects of this cultural divide when compared to descendants of other Spaniards, then we should expect to see its effects in modern Spain. The Canary Islands should exhibit a higher cohabitation ratio than mainland Spain if they are the origin of the marriage pattern we’ve uncovered in Canari America.
So let’s look at the WVS data, the same I’ve been using to analyze Latin American countries, and see if the Canary Islands appear culturally Canarian within Spain. There’s just one problem: Spain did not take part in wave 7 of the WVS. That leaves me no choice but to look at the previous survey, wave 6, conducted in 2011.
Even though the question code in wave 6 (V57) differs from that in wave 7, the question itself and possible answers remain identical, which gives me confidence in the comparability of results from both surveys.
So here are the cohabitation ratios - no map this time - for each Spanish region (Autonomous Community):
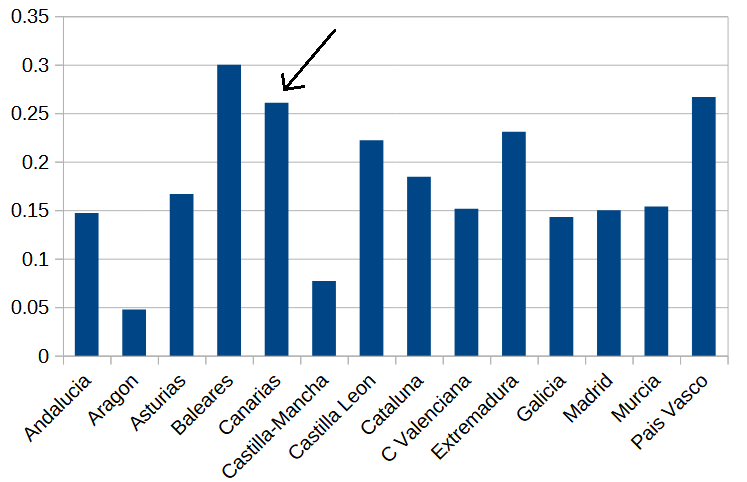
As you can see in the chart, the Canary Islands (indicated by the arrow) had a higher than average cohabitation ratio (0.26) in 2011, though not exceptionally so. Both the Balearic Islands and the Basque Country have similar or higher ratios12. This is not strong evidence for this whole Canarian culture hypothesis.
Let’s try another thing. I know I said that Spain did not take part in wave 7 of the WVS, but it did participate in a similar survey called the European Values Survey (how original), which took place in 2017, around the same time wave 7 of the WVS began.
We can examine the 2017 European Values Survey (EVS) data, but there’s a catch. The equivalent to our familiar question Q273 in the 2017 EVS survey is question X007: “What is your current legal marital status?” - notice the word “legal”.
Then there’s the issue of answer number 2, “living together as married“ (no reference to legal status) in the WVS, which becomes “registered partnership“ in the EVS, implying a particular form of cohabitation under a certain legal framework. This is not the same thing as ordinary cohabitation. Nevertheless, it might be instructive to see how the Canary Islands compare to other Spanish regions using the somewhat different cohabitation ratio defined under the legally recognized form of a registered partnership.
So here they are; “legal cohabitation” ratios for each Spanish region:
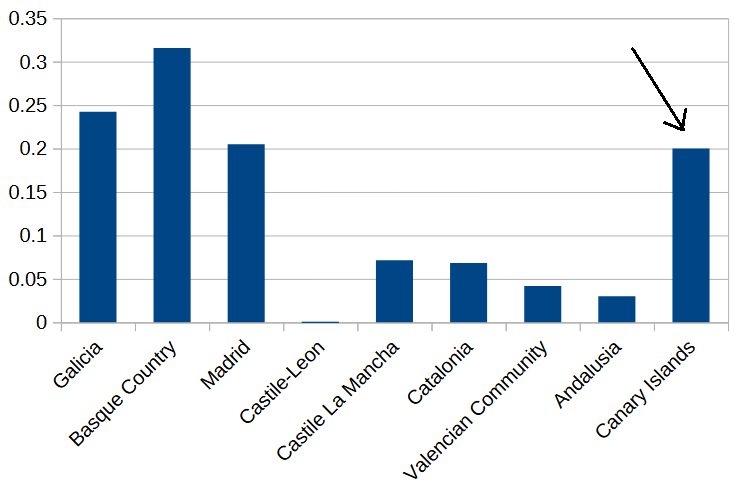
This doesn’t look promising. The Canaries show a higher than average ratio, but so do three other regions.
Let’s step back from the cohabitation to marriage ratio for a moment. Maybe, within the Spanish context, we are not measuring the same thing as in the Latin American context. If that is the case, using an alternative index or variable that is closely related to people’s predisposition towards cohabitation, or aversion to legal marriage, could be a valid way to measure that predisposition (or aversion) without relying on the World Values Survey.
Given that a common consequence of couples choosing to live together, whether married or not, is producing children, it should come as no surprise that Latin America stands out not only for its high rates of cohabitation but also for its high percentage of out-of-wedlock births compared to the rest of the world.

Although the strength of the correlation between a predisposition to cohabitation and out-of-wedlock birth rates likely varies across countries, we can generally expect some degree of correlation.
I should also mention, from a reliability perspective, out-of-wedlock birth rates have one clear advantage over the cohabitation ratios I’ve presented thus far. Unlike the ratios, they are not estimated from a survey, but computed from official birth records of the state we are interested in, which in this case is Spain. So let’s look at Spain’s 2023 birth data, provided by the Spanish statistical institute INE, with a focus on out-of-wedlock births by region (Autonomous Community).
To analyze births outside of marriage, I’ll introduce a new ratio: an out-of-wedlock birth ratio, defined as the number of births to unmarried mothers divided by the number of births to married mothers. While not equivalent to the cohabitation ratio, the out-of-wedlock birth ratio has some properties that make it intuitive if you are already familiar with the previous metric. Its magnitudes are similar to those of the cohabitation ratio, with a value of 1 representing parity between the numerator (out-of-wedlock births) and denominator (births to married mothers); and higher values also indicate, implicitly, a lower propensity to marriage.
And here is the bar chart with the out-of-wedlock birth ratios for each Spanish region.
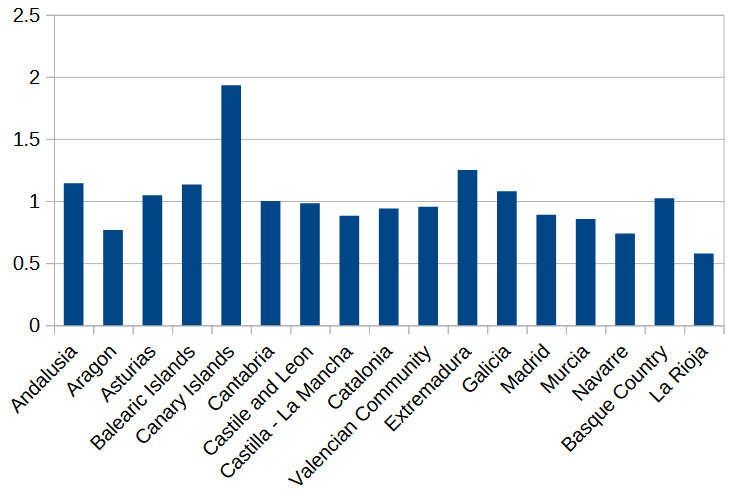
I omitted the arrow pointing to the Canary Islands bar because it’s unnecessary. The Canary Islands bar is the one towering over every other bar. The second-highest region, Extremadura, has a ratio of 1.25, which is 35% lower than the Canaries’.
This provides much stronger evidence that the disparity in marriage patterns between Canari American countries and the rest of Latin America has a mirror image in Spain, between the Canary Islands and the rest of the country. I strongly believe this disparity stems from a lower propensity to marriage among Canarians than among other Spaniards.
So there you have it: political culture, religious culture and marriage patterns; all these cultural facets make Canari America stand apart from the rest of Latin America.
Well, relatively free at least.
The proxy measure that I used to gauge religiosity is named CPP: Catholics Per Priest. I interpret a higher CPP ratio as indicating lower religiosity, and conversely a lower CPP ratio (more priests per each Catholic) as indicating greater religiosity. This is somewhat controversial; you can read the arguments against my interpretation in the comments.
Honestly, I’m slow. Other Canari America posts are going to take a while.
Although I did include the Inglehart–Welzel Cultural Map of the World, based on World Values Survey data, in a previous post.
Well, I also made use of the data indicating the region where the interview was conducted.
Costa Rica, Cuba, the Dominican Republic, El Salvador, Honduras, Panama and Paraguay were not included in Wave 7 of WVS.
In fact, that is the case of Guatemala, with 49% of respondents identifying as single.
I’ve had many discussions over the years about cultural differences between Latin American countries, and these exchanges have convinced me that many Latin Americans readily accept “Caribbean culture“ as an explanation.
The white-colored Argentine province west of Uruguay is Entre Ríos. There is no data in wave 7 of the WVS for Entre Ríos Province.
The ratio for Caquetá, Meta and Putumayo departments of Colombia is 3.43 cohabiting individuals per each married one.
Though only 24 respondents took the survey in the Balearic Islands, so please take that result with a grain of salt.
Very interesting, Javiero. Thank you for this analysis.
Another complicating factor in interpreting causes for rates of out-of-wedlock births are regional differences in history of slavery. I know more about this in the Caribbean than in Latin America, so I'll use just the Caribbean as my example.
So, when people from West Africa were brought to the Caribbean as slaves to work in monoculture agriculture (mainly sugarcane), it was initially just men. Later, women started to be imported as well. Different colonizing countries had different approaches regarding how to import women and the legal status of children born of enslaved women, but a common theme was that relationships between slaves were easily dissolvable. Even in places where enslaved men and women were allowed to "marry" each other, the marriage could be dissolved at the whim of the owners. Further, it was common for enslaved women to be impregnated by their owners, with no legal obligation on the part of owners to recognize the children as their own. I think this is a mechanism that would lead to cultures that do not see much of a difference between marriage and cohabitation, and see single motherhood as the typical way children might be raised.
In addition to your data showing some relationship between Canarian influence in particular Latin American regions and marriage/cohabitation/unwed parenthood rates, I also wonder what the history of African import chattel slavery was in these regions. To my uneducated eye, it looks like there's some relationship: the farmlands of Colombia and Venezuela had much more monoculture agriculture and thus chattel slavery than did, say, the mountains of Peru.
I would be interested to know your thoughts.