
Is it Canari-Caribbean or Afro-Caribbean?
Exploring an Afro-Caribbean hypothesis to explain Canari-American cultural traits.

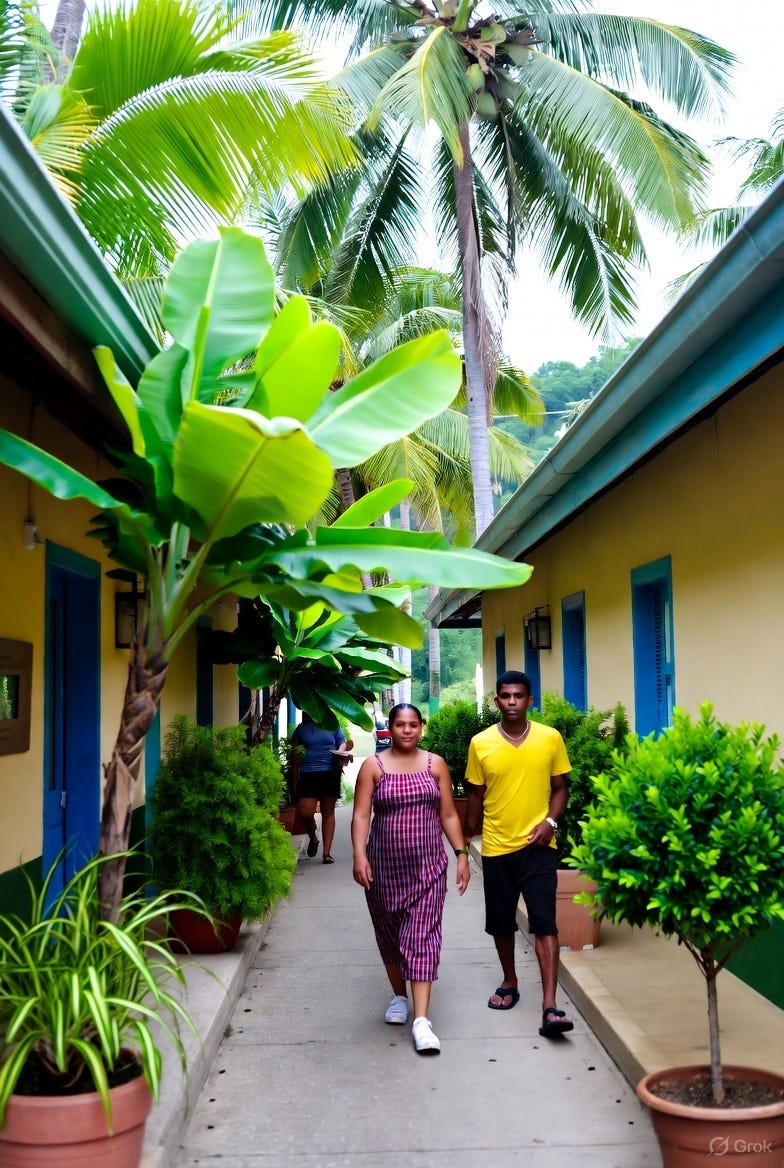
When people think about the Caribbean, distinct images spring to mind that capture certain salient attributes of the region. These scenes are framed by elements of vegetation and flora, such as tropical palms and beautiful lush greenery, architectural styles adapted to the tropical environment, and even uniquely looking clothing and personal ornamentation worn by the residents of this equatorial region.
The people inhabiting these Caribbean scenes usually display traits associated with one of the two main population groups that settled the region after 1492: Hispanic and African. Oftentimes they show a blend of these features, reflecting their mixed background.
The substantial African ancestry is explained by the deep impact of slavery, with millions of people forcefully brought from the other side of the Atlantic to work on the region’s plantations, while the sizeable Hispanic ancestry is of course explained by Spain’s main role in colonizing the Americas, particularly the Caribbean. And within that Hispanic ancestry, which originates from several distinct regions of Spain, a substantial portion comes from the Atlantic archipelago of the Canary Islands.
I’ve written several posts describing the region of Latin America that I call Canari America, detailing the cultural traits that distinguish it from the rest of Latin America, and arguing that these traits derive from the Canarian migrants that heavily settled this region.

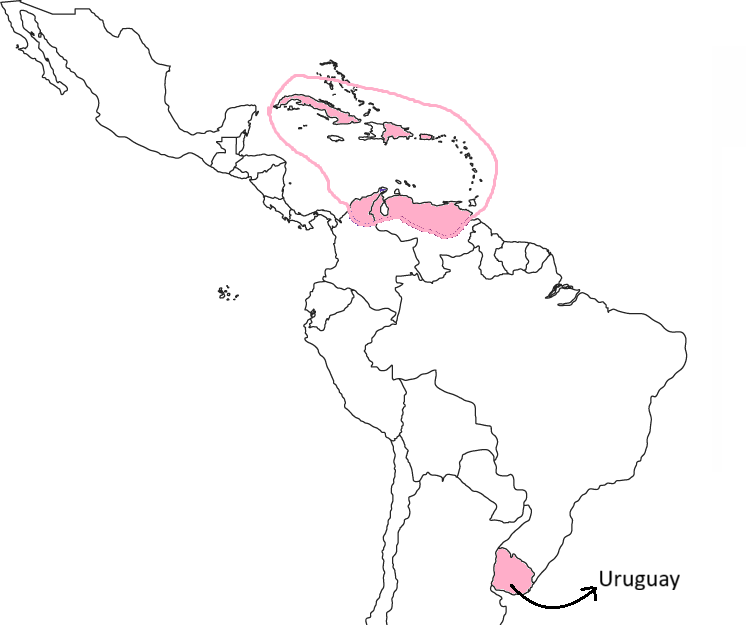
The geographic area of this region largely, but not entirely, coincides with the Caribbean area. Some countries are widely regarded as part of the Caribbean yet clearly not part of Canari America, such as Haiti and Jamaica, while other countries with significant Canarian influence, like Uruguay, are located far to the south of the Caribbean sea.
Given all this, it’s not surprising that a common objection to my characterization of Canari America is that the region I’m really describing is the Caribbean, and the cultural traits I’ve attributed to Canarian influence are actually Caribbean cultural traits. Specifically, if Hispanic and African ancestry influences are so dominant in the Caribbean basin, maybe I’m presenting certain cultural attributes as Canarian when they are really characteristic of Afro-Caribbean culture.
The cultural traits - I’ve been harping on about them in my previous posts - are three:
Canarians (and Canari-Americans) show low religiosity as measured by the Catholics per priest index (CPP); a measure of how many priests are required by a diocese’s flock.
Canarians have a particular marriage pattern, with higher cohabitation-to-marriage ratios1 than other Spaniards. This is based on World Values Survey data on marriages.
Canary Islanders (and Canari-Americans) consistently lean left in their political preferences.
I now intend to investigate whether these “Caribbean“ traits can be presumed to stem from Afro-Caribbean culture, thereby casting doubt on their Canarian origin, or whether any connection to African ancestry can be clearly rejected.
Certain regions of the Hispanic Caribbean offered almost ideal conditions for cultivating cash crops like sugar and cocoa, enabling the emergence of a thriving plantation economy based on enslaved labor. In contrast, areas less suitable to the profitable exploitation of forced labor experienced limited slave importation and relied more heavily on free labor. Eastern Cuba, with its focus on sugar cultivation2, saw the arrival of countless African slaves whose descendants to this day inhabit the region, while Western Cuba, with an economy mainly centered on tobacco and a greater reliance on free labor shows a lower proportion of African ancestry today.
These regional differences in African ancestry offer an excellent way to test whether certain cultural traits are Afro-Caribbean or not. Is Eastern Cuba less religious - a trait I’ve linked to Canarian culture - than the rest of Cuba? If the answer is yes, I’d be slightly more inclined to believe I might be conflating Afro-Caribbean and Canarian culture. If no, that would make me slightly more inclined to believe that lower religiosity in Cuba is truly a Canarian trait.
So, which one is it?
To answer this question, I’ll use the Catholics per priest (CPP) metric I mentioned above. A higher CPP ratio indicates lower religiosity, while a lower CPP indicates higher religiosity. You can see below the 2020 CPP ratio for each Cuban diocese, ordered roughly from west to east.
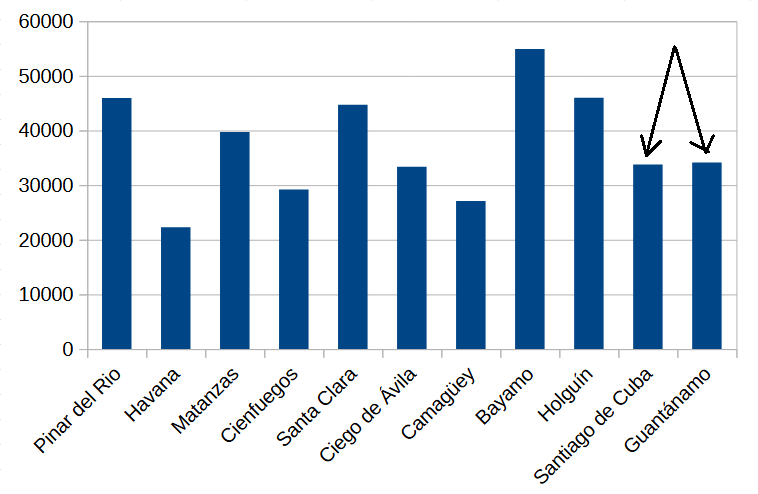
The two rightmost dioceses (marked by black arrows) correspond to Eastern Cuba’s Santiago de Cuba and Guantánamo provinces, and as you can see, they don’t have particularly low or high ratios, indicating their religiosity doesn’t differ much from the Cuban average3.
This evidence favors the non-conflation hypothesis, but it’s just one piece of data4 among many to weigh before choosing to believe the non-conflating or the Afro-Caribbean hypothesis - or perhaps some kind of synthesis of both. And it relates to only one of the cultural traits I’m interested in. I’ve already mentioned another trait, political culture, which I believe leans left in populations of Canarian ancestry (though some might attribute this political leaning to Afro-Caribbean influence5).
I have to ignore (for the time being!) the political hue of the government that has ruled Cuba for the last six decades, since it reveals little about the political leanings of Afro-Cubans. Yet, while searching for data on Afro-Cubans’ political preferences, I did find two pre-revolutionary elections with provincial-level results, allowing us to compare Oriente Province (roughly equivalent to Eastern Cuba) with the rest of the country. These are the 1944 and 1948 general elections.
The 1944 Cuban general election pitted an alliance of the Authentic Revolutionary Party and Republican Party against a coalition of the Liberal Party, Communist Party6, Democratic Party (right-wing) and ABC Party7. The Authentic-Republican alliance, dominated by the left-wing Authentics, obtained 60.87% of the Senate vote in Oriente Province and 55.39% of the national presidential vote.
In the 1948 Cuban general election, the Liberal Party8 achieved 30.38% of the national vote and 27.29% in Oriente. While on the left, the Communist (PSP) party obtained 7.47% of votes in Oriente, barely above their national 7.25%, and the extreme-left Orthodox Party, led by Eduardo Chibás, got 16.46% nationally and 20.35% in Oriente9.
In contrast to the previous CCP ratios, these figures slightly favor the Afro-Caribbean hypothesis, hinting that the question of which hypothesis is correct is not easy to answer. Also, notice that I’m comparing along three different dimensions, which are not necessarily correlated with each other. It could be that the answer is: 1 out of 3 cultural traits supports hypothesis X, or 2 out of 3 cultural traits support hypothesis Y.
To reach some sort of conclusion - even a partial one - we need to look at plenty more data from other Caribbean countries besides Cuba. That is what I’m going to do next, and it’s going to be a long and dry (and boring for some) examination of CPP ratios, election results and cohabitation rates across three additional Caribbean countries. If you are not particularly interested in reading several pages of data, I recommend you skip to the conclusions.
The Free Associated State
Puerto Rico’s population of African ancestry is not as numerous as Cuba’s, but like Cuba, it is concentrated in a specific region: the northeast of the island. This region, centered on the town of Loíza10, is the one whose metrics (CPP ratios, etc) I’m going to compare with those of the rest the island.
Let’s start with the CPP ratio. The diocese of Fajardo-Humacao is the most African diocese in Puerto Rico, encompassing Loíza and the towns of Fajardo, Humacao, Naguabo, Ceiba, Canóvanas, Luquillo and Río Grande (some of these towns will show up again later). Its CPP ratio of 3,340 is the lowest among Puerto Rico’s six dioceses, suggesting it’s the most religious diocese in the island11.
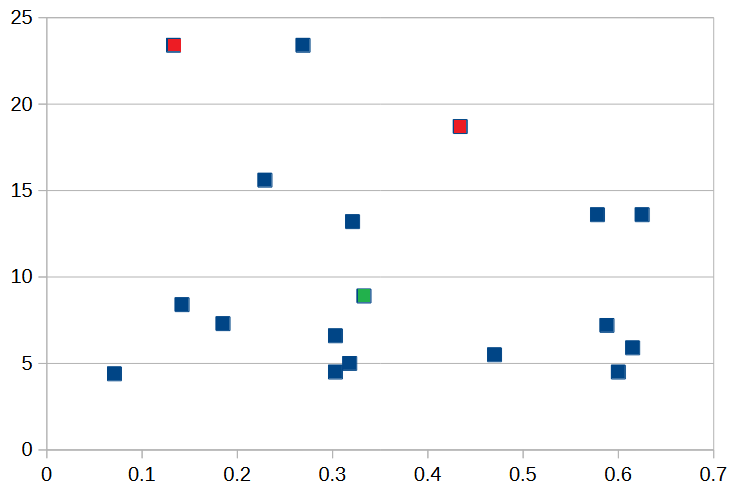
Now, let’s look at Puerto Rico’s cohabitation-to-marriage ratio according to wave 7 of the World Values Survey (WVS). The ratio for Puerto Rico as a whole is 0.32912, while Eastern Puerto Rico’s ratio is 0.283, second-lowest among the six regions defined by WVS. There’s a caveat though: the WVS does not sample every town in Puerto Rico13; for Eastern Puerto Rico it only sampled Canóvanas (23.4% Black or African American), Juncos (8.9% Black) and Río Grande (18.7% Black). As a result, some sampled towns in Eastern Puerto Rico may have a low share of Black or African American population (Juncos?), while certain towns outside Eastern Puerto Rico could have a high level of African ancestry.
To address that issue, I calculated the correlation coefficient (Pearson’s) between cohabitation-to-marriage ratios and percentage of Black or African American population across all the sampled towns. And that coefficient is -0.15, implying (maybe) a very weak inverse correlation between the two variables: higher African ancestry slightly predicts a lower cohabitation-to-marriage ratio. However, as you can see in the following scatterplot, where it’s hard to visualize any trend, it’s very doubtful there’s any correlation, positive or negative, at all14.
For reference, 10.9% of the total population of Puerto Rico is Black or African American.
Finally, before tackling the third cultural trait of interest to us, political culture, please notice that, unlike U.S. polls, which often break down results by respondents race, Latin American polls do not typically ask for the respondent’s race. It would be rare to find a Latin American political survey that breaks down data by racial identity. To test any correlation between African ancestry and political leaning, the best I can do is look for correlations between high-African-ancestry districts or regions and electoral results.
The earliest meaningful Puerto Rican election results I can find are those from the 1952, 1956, 1960 and 1964 elections. At the time, the current right-wing New Progressive Party (PNP) did not exist, and its predecessor - the Partido Estadista Republicano - was crushed in every general election by Luis Muñoz Marín’s dominant Popular Democratic Party (PPD). In these early results, there are no geographic patterns that I can discern.
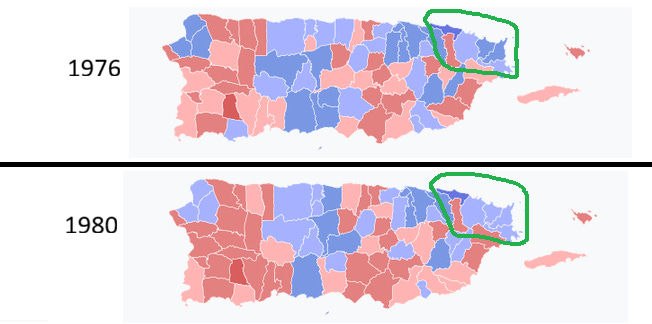
Moving on to the 1970s and 80s15, the PPD won the 1972 election by a wide margin, but Fajardo and Loíza were among the sole six municipalities that backed the right-wing PNP16. The 1984 and 1988 elections show no clear preference for the PNP in northeastern Puerto Rico, but the 1976 and 1980 elections do (except for Canóvanas).
The general elections of 1992, 1996 and 2000 show every northeastern Puerto Rico municipality favoring right-wing candidates. The only exceptions were Canóvanas (1992 and 2000) and Luquillo (only 2000), which voted for PPD candidates17. In the 2004 and 2008 gubernatorial and Resident Comissioner elections, all northeastern Puerto Rico municipalities voted for right-wing PNP candidates.
The 2012, 2016, 2020 and 2024 gubernatorial and Resident Commissioner elections show the same recurring pattern, except for Río Grande (2012 and 2020 gubernatorial; 2012 and 2024 Resident Commissioner) and Juncos (2024 Resident Commissioner).
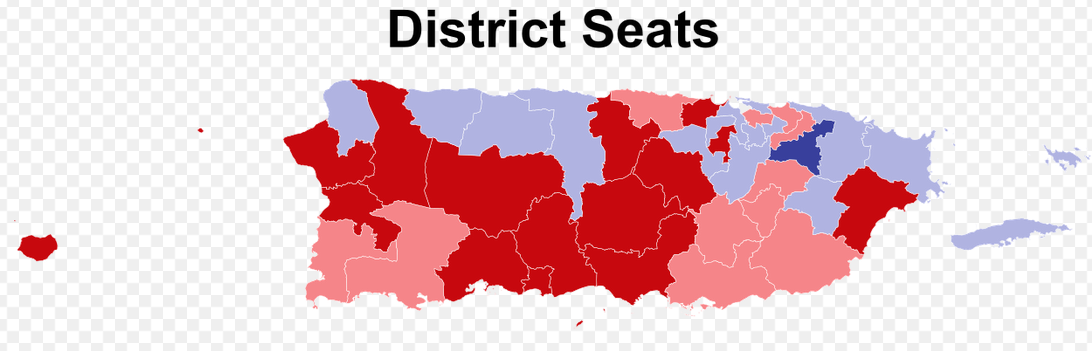
Lastly, regarding recent Puerto Rico House of Representatives elections, the PNP won in the three northeastern districts (36, 37, 38) in 2020 and 202418, despite the overall defeat of the PNP in 2020.
To summarize, the region of Puerto Rico with the most African ancestry appears to consistently lean right.
Colombia
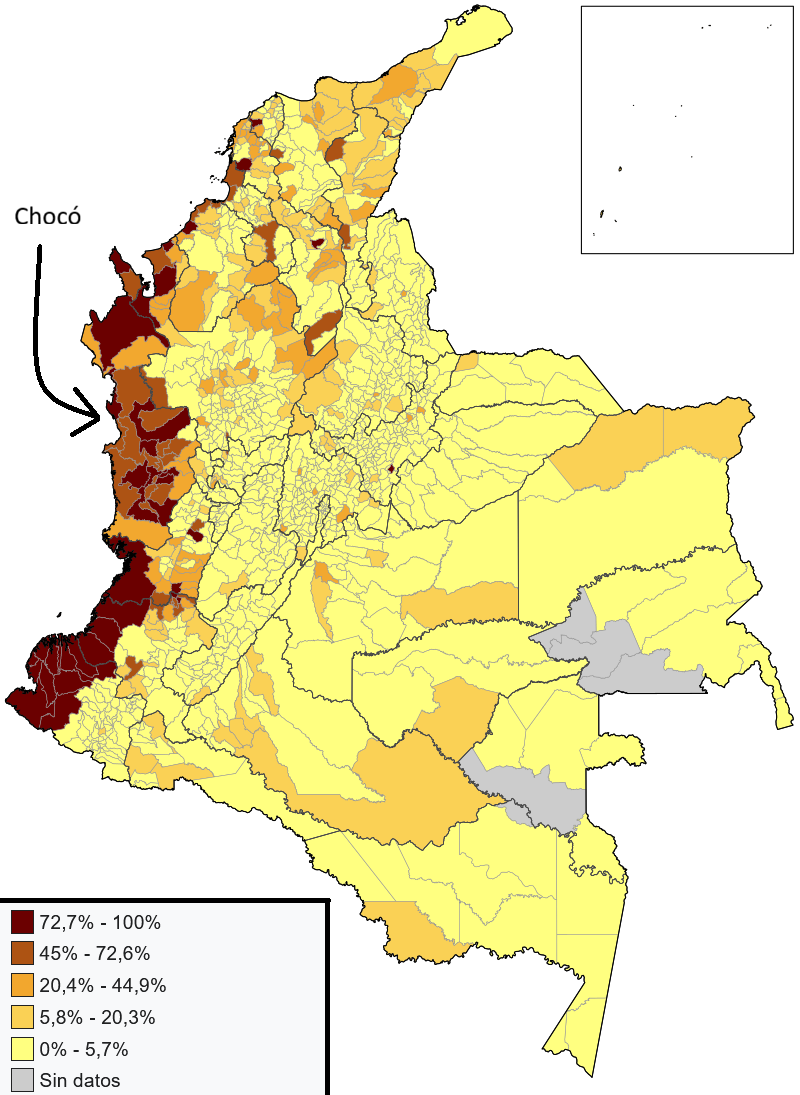
Our next stop is Colombia, a country with a substantial number of Canarian descendants, especially in its Caribbean coast, and also a large population of predominantly African ancestry. The Afro-Colombian population is concentrated near the Caribbean and Pacific coasts, with peaks in the departments of Chocó and San Andrés and Providencia - a Creole-speaking Caribbean archipelago located 775 kms away from the Colombian shore.
.svg)
Unfortunately, the Protestant persuasion of the Afro-Colombian population of San Andrés and Providencia means that calculating a CPP ratio for the archipelago is useless. But we can instead take a look at the ratios of Chocó’s two dioceses and a few others along the Pacific Coast and compare them against the CPP for the whole of Colombia: 5,605.
This, intriguingly, reveals two distinct patterns. The Chocó dioceses - Quibdó (CPP 6,360) and Istmina-Tadó (CPP 2,202) - have CPP ratios comparable to or below the national average, suggesting Afro-Colombians have higher religiosity than average. But then the Pacific coast dioceses of Buenaventura, Guapi and Tumaco have ratios ranging from 7,300 to 12,300 - substantially higher than average - suggesting lower, not higher, religiosity than Colombia as a whole19 and contradicting the previous pattern.
To make matters worse, among the three dioceses corresponding to Colombia’s three main Caribbean cities - Barranquilla, Cartagena and Santa Marta - the most African one, Cartagena, has the lowest CPP, even though all three significantly exceed the national average20. These figures seem a bit contradictory. Is the religiosity of Afro-Colombians higher or lower than that of other Colombians? I don’t intend to give a final answer yet - before examining more countries - so I’ll leave that question open for now.
Now, regarding cohabitation ratios, four municipalities with a high share of Afro-Colombian population21 took part in the WVS wave 7: Nuquí (Chocó), Tumaco (Nariño, Pacific coast), Cartagena and Cali. All four surpass Colombia’s average of 1.582 cohabitations for each marriage, with ratios of 6.0, 1.75, 3.4, 1.86 respectively22. That suggests higher African ancestry is correlated with higher prevalence of cohabitation, and I’m not going to dispute that23.
Lastly, let’s check whether Afro-Colombians have any political bias compared to other Colombians. I examined the vote share for left-wing 2022 presidential candidate (and eventual winner) Gustavo Petro in each municipality, and then compared that share to the proportion of self-identified Afro-Colombians to detect any effect on the first round left-wing vote. I only included in this analysis the 11 Colombian departments with the highest African ancestry: seven from the Caribbean coast and four (including Chocó) from the Pacific coast24.
What are the results?
The correlation coefficient (Pearson’s r) between Afro-Colombian population percentage and Petro’s vote share is positive (0.27); higher African ancestry is linked to higher support for Petro, but the connection is very weak (R2 is 0.071). And the results are very much the same if I restrict the analysis to just the three Pacific coast departments (coefficient = 0.28, R2 = 0.077), or the Pacific coast plus Chocó (coefficient = 0.29, R2 = 0.071)25.
I then restricted the analysis to the seven Caribbean coast departments. They show no correlation (-0.023) and a value of R2 close to zero. The conclusion I must draw from this is that the vast majority of Afro-Colombians (see footnote 24) exhibit no proclivity to vote left or right compared to other Colombians.
What about Panama?
The Isthmian country’s population of African descent has an interesting origin story. Alongside its Afro-Panamanian community of colonial origin, similar to that of Colombia, Panama is home to an Afro-Antillean population descended from West Indian workers who were recruited to build the Panama Canal. Many of these workers settled in the Canal Zone, the area of Panama that was under American sovereignty from 1903 to 1979, or close to the American-administered canal, including the city of Colón and its surrounding region, which now constitute the Province of Colón.
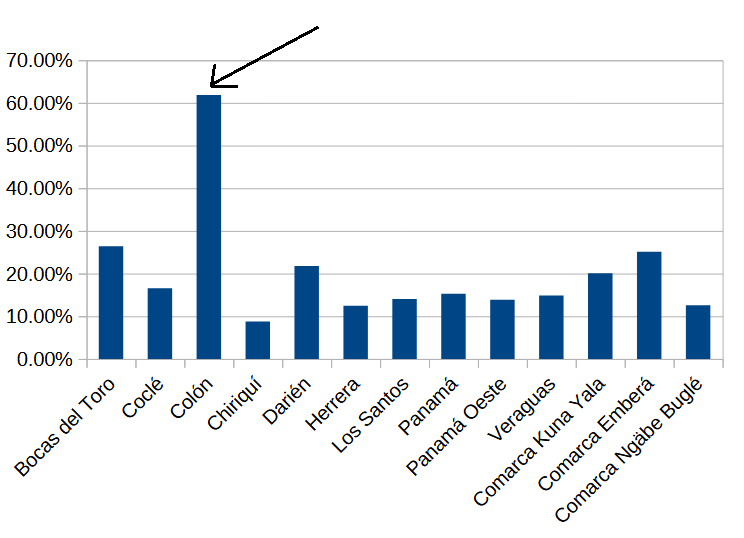
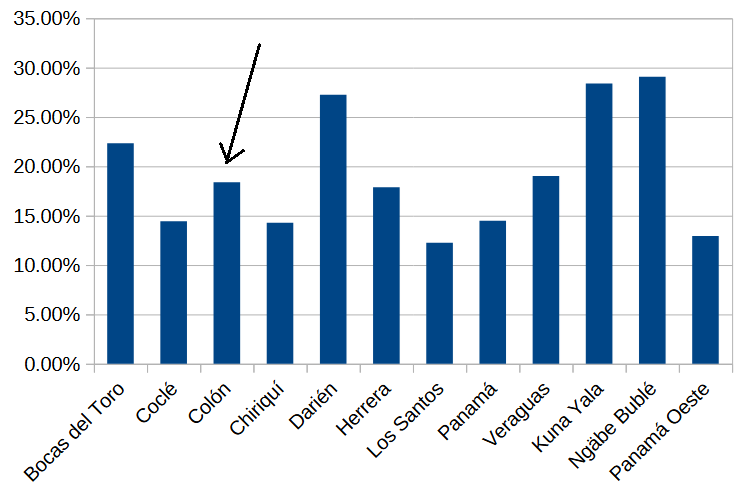
This is the main reason why Colón Province has the highest share of Afro-Panamanians among all of the country’s provinces26. Approximately 61% of Colón’s population is Afro-Panamanian, compared to a share ranging from 17% to 37% in every other province27. If the cultural traits I’ve been analyzing are Africa-Caribbean in origin, they should be more prominent in Colón than everywhere else in Panama.
Let’s start with the CPP rate by looking at the rates of all Panamanian dioceses. The diocese of Colón also includes the territory of the Kuna Yala Indigenous Comarca, but since the comarca has barely a ninth of Colón Province’s population, we can just treat the diocese’s CPP as a good measure of the province’s religiosity and disregard the effect of Kuna Yala’s population on the rate.
These are the CPP rates of every Panamanian diocese:
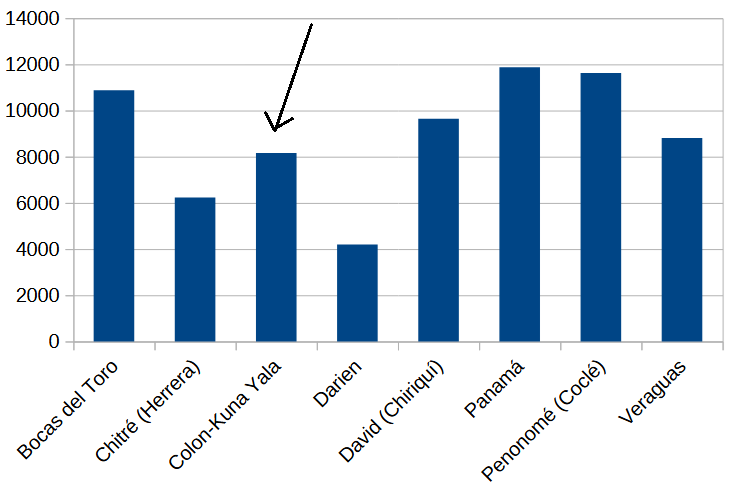
Colón Province, with a rate of 8,166 Catholics Per Priest, is more religious than Panama as a whole (CPP 8,488).
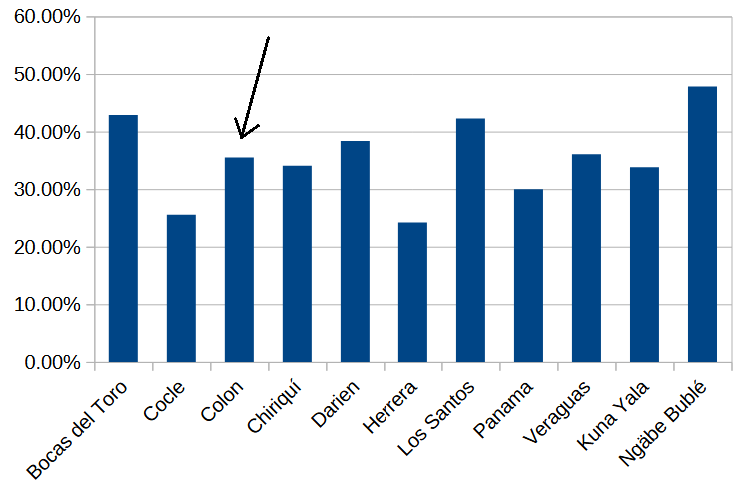
Next, let’s look at marriage patterns in Panama. Since the country did not take part in wave 7 of the World Values Survey, I’ll use out-of-wedlock births as a proxy for cohabitation28, excluding children born to mothers in civil unions. This is a cultural aspect in which Colón Province stands out from all other provinces.
Colón’s 62% of out-of-wedlock births is by far the highest among all provinces.
Finally, regarding the political leanings of Afro-Panamanians, I couldn’t find provincial election results prior to the year 2009, so that year’s general election is the earliest I could analyze. And there wasn’t much to analyze. The right-wing candidate won 60% of the vote nationally and a majority in every province but four29, so his victory in Colón doesn’t reveal much.
The next presidential election, in 2014, saw a victory for the left (PRD party) in Colón Province, while the following 2019 election brought a defeat. And as for the legislative results, I found the 2014 vote percentages for left-wing parties but only found the number of seats won for 2019 (two out of four). Here are the 2014 results.
These results are similar to the ones for the 2024 legislative election, where again Colón Province voted slightly more left than the country as a whole30, but not remarkably so.
In fact, in the 2024 presidential election, Colón Province voted slightly less left than the national average, with 5.81% of votes cast for left-wing candidates31 compared to 6.64% nationwide. Overall, these results show that Colón, the most Afro-Panamanian province in the country, does not lean more left than Panama as a whole, suggesting that Afro-Panamanians are not particularly left-leaning.
To summarize, Afro-Panamanians are more religious than the national average, have significantly higher rates of out-of-wedlock births, and don’t seem particularly left-leaning or right-leaning within Panama’s political spectrum.
Conclusions
I wish I had more data on which to base my conclusions32, but for now this is all I have. So, to summarize, of the three cultural traits that I’ve characterized as Canarian, two of them show strong evidence against an Afro-Caribbean origin, making what I called the Afro-Caribbean hypothesis highly unlikely. These are low religiosity and a political bent to the left, both of which now look even more likely to be Canarian in origin.
The third one, higher cohabitation-to-marriage ratios, does appear to be connected to Afro-Caribbean culture, conflating the supposed Canarian origin of higher cohabitation in Canari-American countries with a possible Afro-Caribbean one. I have now updated the probability I assign to an Afro-Caribbean origin of this trait from low to not-so-low33.
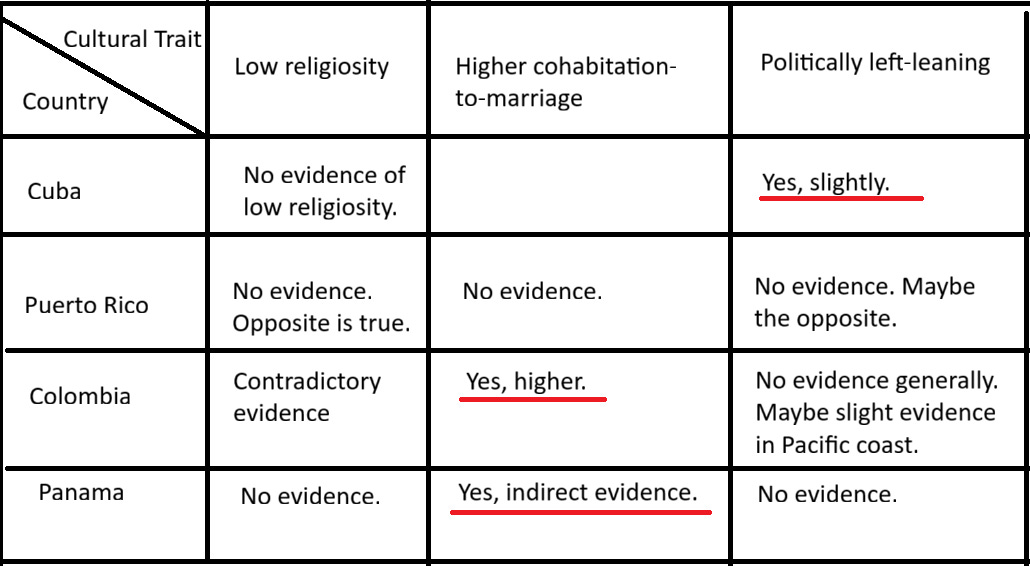
To help you better evaluate the data, and decide whether you agree with my conclusions or not, here’s a summary table of all the evidence I’ve examined in this post, arranged by country and cultural trait.
When trying to explain what makes some Latin American countries different from others, what characterizes them, and analyze the cultural attributes that shape their societies, I don’t believe that just a simple “they have a lot of Canarian ancestry, so obviously those cultural traits come from the Canary Islands” is enough. Questioning what might seem logical at first sight is a healthy exercise - and I’m glad that I now have to revise my claim that high cohabitation ratios in Latin America are clearly Canarian in origin.
I’m also glad that I’ve addressed what I see as the strongest objection to a Canarian origin for the two other cultural traits - successfully I hope; if you are still not convinced, please let me know in the comments. Now I look forward to moving on to (hopefully) less dry, less data-intensive topics related to Canari-America.
And higher out-of-wedlock birth rates, but I’ll examine out-of-wedlock birth rates only if I can’t find cohabitation data.
And to a lesser extent coffee and cocoa.
Holguín Province, with its substantial Afro-Cuban population, could arguably be considered part of Eastern Cuba. Its CPP is higher than those of Santiago de Cuba and Guantánamo, though not exceptionally so.
Another piece of data supports this: the 1908 Cuban CPP ratios, the earliest my source (which I can’t praise enough) provides. In that year, the CPP ratio of Santiago de Cuba was 7,297, compared to ratios of 9,611 in Pinar del Río, 4,250 in Habana and 6,835 in Cienfuegos, placing Santiago de Cuba (the sole Eastern Cuban diocese at the time) above the Cuban average but in second place after Pinar del Río.
I can’t pretend to be unaware of where the idea that voters of African ancestry lean left originates. The American cultural footprint is large and influential.
The Communist Party was actually called Popular Socialist Party (PSP) at the time. The PSP was only a minor partner in the coalition, so I don’t classify the whole coalition as left-wing.
It’s hard to classify the ABC Party as a rightist or leftist party, but it was certainly a revolutionary party.
Which could be described as a classical liberal party.
Though it should be noted that Chibás and the party’s second-in-command, Emilio Ochoa, were both from Oriente, which may partly explain the party’s stronger support in the province.
According to the 2000 census, Loíza’s Black or African American population (alone or in combination with one or more other races) comprised 62.2% of the total.
A “corrected” CPP using total population (not just Catholic population) as the numerator would show Fajardo-Humacao diocese having the highest CPP in Puerto Rico. But this is just an artifact of the high level of Protestant affiliation in the diocese’s area.
I should have included Puerto Rico in the cohabitation ratio map of my Canari-American marriage pattern post. For what it’s worth, 0.329 is a low ratio by Latin American standards.
You can download the list of all sampled towns (“WVS7 Codebook Variables report V6.0.pdf“) from here.
The value of R2 is 0.025, which is pretty bad.
The 1968 general election does not show any clear pattern.
The municipality of Cataño (23.4% Black or African American), part of the San Juan metropolitan area, was also among the six.
I don’t have detailed results for the 1992 and 1996 elections, so take this with a grain of salt, but going by the Wikipedia maps, Loíza, Puerto Rico’s most African municipality, was the only one to vote overwhelmingly PNP (> 60%) in both elections (also 2004 and 2008?).
I can’t find data on House of Representatives elections prior to 2020.
There is also the diocese of Apartadó, with a CPP of 11,937, spanning a small part of Chocó and a larger portion of Antioquía.
Barranquilla: 15,732; Cartagena: 10,035; Santa Marta: 11,563.
The least Afro-Colombian of those municipalities is Cali: 14.41% according to the 2018 census, or 26.40% if you choose to believe the 2005 census.
In fact, San Andrés and Providencia also participated in the WVS, but I’m skeptic of its low ratio (1.2) because only 16 respondents completed the survey.
In fact, running a regression on all Caribbean coast municipalities included in the WVS corroborates the correlation between higher African ancestry and higher prevalence of cohabitation with a R2 of 0.33, which is not a bad fit.
I excluded San Andrés and Providencia, which only has one municipality.
I was intrigued enough by the positive correlation shown by the Pacific coast that I decided to run a separate regression for each department (including Chocó). The only department in the Pacific coast that shows a credible correlation is Valle del Cauca, with a coefficient of 0.60 and R2 of 0.36.
Panama has four Indigenous Comarcas besides its ten provinces. These Comarcas enjoy a high degree of autonomy and - unsurprisingly given their predominantly Indigenous population - few Afro-Panamanians live in them (less than 5%).
I estimated the percentage of Afro-Panamanians in each Panamanian province from the number of people living in a household led by an Afrodescendant as stated in Cuadro 45 of the 2023 census.
Source is Cuadro 13 of Vital Statistics published by Panama’s National Statistics and Census Institute.
Those four provinces all happen to be Indigenous Comarcas.
In 2014, 35.5% of the citizens of Colón voted left, compared to 32.5% of voters nationwide. In 2024 the figures were 18.40% and 16.25%, respectively.
José Gabriel Carrizo (only PRD votes) and Maribel Gordón. Source: Panama’s Electoral Tribunal.
I just can’t do the same analysis of CPP and cohabitation ratios for the Dominican Republic because the DR didn’t take part in the WVS, demographic data on ethnic background don’t seem reliable, and there is no straightforward way to distinguish Afro-Dominicans from Haitians. Venezuela seems even more unfeasible.
I still think Uruguay’s - a country with very little African influence - exceptionally high cohabitation ratio supports a Canarian origin.