
The Covid-19 narrative
Repost of an old April 2020 article

This is a repost of an old article I originally posted in April 2020 in my old newsletter. It might contain some errors that are only obvious now, three years later, when we know so much more about Covid-19 and how it spread. I decided to repost it without editing so it can also serve as a testimony and reminder to how I thought about Covid-19 at the time.
Without further ado, here’s the article.
With the Covid-19 epidemic raging around the world it’s easy to lose track of its history, short as it is. Fighting the epidemic day to day and week to week requires a lot of effort and it should be so. Lives are on stake and the people who are on the front lines of this fight don’t have the time to stop and think about the narrative of the epidemic.
I agree with that assesment. But eventually the history of Covid-19 will be written down, books will be published, not all of them will agree in their narrative, but some kind of narrative will emerge, maybe years from now, maybe decades from now. It’s just in our human nature to crave for narratives.
This article will mostly focus on the current narrative for the epidemic in Western Europe, or at least what I think is that current narrative, and then go on to explain why I think it’s wrong.
First, this is the narrative as I think it currently stands. You can skip to the An alternative narrative part if you’ve already heard this a hundred times.
By the first week of January a new flu-like virus has been discovered in the Chinese city of Wuhan. Nothing to worry in old Europe, Wuhan is far away, cases are few and are being monitored in hospitals, no one has even died yet.
By the middle of January people start dying in Wuhan, the genetic code of the virus is published confirming it’s a new Coronavirus and allowing for tests to be done to those who show symptoms, and contradicting information about what happens in Wuhan (Chinese new year as usual? virus spreads fast?) comes out of China.
On January 22 the outbreak escalates, the Chinese CDC admits human to human transmission, confirmed cases are reported in several cities and provinces in China, 17 deaths in Wuhan, and confirmed cases were also reported in other countries: Japan, Taiwan, Thailand, South Korea and the United States. On January 23 Wuhan starts its lockdown, things are looking serious.
On January 24 the first three cases are reported in France. On January 27 the first case is reported in Germany, with several new cases during the following days in both countries. It looks like the virus has gotten into France and Germany first, while the rest of Europe keeps adding more measures (airport screening, 14 days quarantines) to try and delay the certain arrival of the virus. All countries in Western Europe have the capacity to test for the virus and have been doing tests on those more likely to be infected (symptoms, recent arrival from Wuhan). Flights to and from China are suspended.
On January 31 the first case is reported in Italy. On February 6 the second case is reported in Italy. On February 16 a man is admitted to Codogno hospital in Lombardy. By February 21 he’s been tested positive along with several others in Lombardy and the first death is reported in Italy. A week later Italy is a hotspot with more than 20 deaths, and lockdown has been implemented for more than 50 thousand people. Other countries in Europe start taking measures to try to avoid contagion from Italy.
Farther away from Europe, the first case is reported in Iran on February 19. One week later Iran is a hotspot for the pandemic. We hear a merchant from Qom might have brought the virus into Iran.
Starting on February 25 the first cases are reported in Switzerland and they seem to point towards contagion coming from Italy. A few weeks later Swizterland will be one of the countries most affected by the epidemic in the entire world.
An alternative narrative
We know for sure that the virus is being transmitted from human to human, and if it originated in Wuhan then it must have been one or many humans who carried the virus from Wuhan to somewhere in Europe, maybe directly or maybe through some other country or region. The current narrative implicitly supposes a small number of carriers, and you can see this reflected in the fact that most Western European countries consider their first official cases to have been someone who brought the virus from some other European country, and not directly from Wuhan:
Austria: first from Italy, second from Italy
Belgium: first from France, second from Italy (not counting repatriations)
Denmark: first from Italy, second from Italy
France: first from China, second from China
Germany: first from China, second from China
Ireland: first from Italy, second from Italy
Norway: first from China, second from Italy
Portugal: first from Spain, second from Italy
Spain: first from Germany, second from the UK
Sweden: first from China, second from Italy
Switzerland: first from Italy, second from Italy
The Netherlands: first from Italy, second from Italy
The UK: first from China, second from China
These seems to have created the impression of the following scenario. A few people (Chinese or Europeans) carry the virus from Wuhan to Europe, probably to Italy, maybe to Germany and/or France as well. Either directly or by way of Germany the virus reaches Italy and then spreads very very fast, pouring into neighbouring countries.
An alternative reading would involve a few carriers spreading the virus into several European countries (France, Germany, Italy, maybe some others), and then Italian culture (you know, the opposite of social distancing) making the outbreak much worse in Italy than the others to the point where infected people start pouring into neighbouring countries.
I believe this narrative, or any narrative similar to this, is wrong. I believe many people carried the virus from Wuhan to Europe during the timeframe when it might have been possible, before lockdowns and travel bans. I think there was no Italian culture factor.
The data
First, carriers are people who traveled from Wuhan to Europe for one of the following reasons: leisure (tourists), work, visiting friends and relatives (VFR). Most data I could find doesn’t discriminate between the reasons for someone visiting a country, they are all the same. Most data doesn’t say whether a Chinese worker or tourist goes to Germany from say Shanghai or Wuhan. Most data doesn’t say whether a Dutch worker or tourist goes to China with the intention of visiting Beijing or Wuhan.
Most data does not show seasonality. Did Belgium recieve more Chinese visitors during January or July?
Some data records nights spent by Chinese visitors in country X, while some data just records the total number of Chinese visitors to country X.
So here’s the first graph of Chinese visitors v/s deaths by March 25, by country.
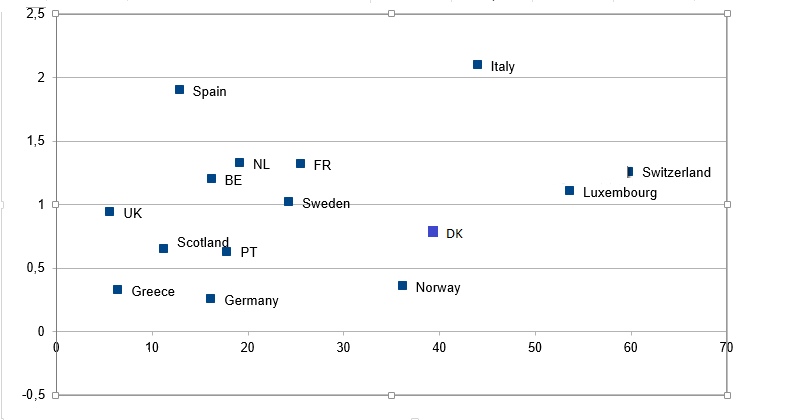
The X axis is the expected number of Chinese visitors for every 1000 people for a given country for a whole year.
The Y axis is log10 of the number of Covid-19 deaths reported until March 25. Most estimates I’ve seen put the time from onset to death between 20 and 22 days. So tallying deaths by March 25 gives us a good estimate for how many infections did country X have during the first days of March, before any lockdowns (except parts of Lodi province, Italy) or forced social distancing became common.
Not a very clear correlation. If there is supposed to be some correlation between the number of visitors from China (leisure or work related) and the number of cases for each country, some countries would appear to be outliers. Spain, Belgium, the Netherlands, the UK, maybe Norway. And Italy doesn’t look like such a public health disaster, but still worse than it “should”.
I’m going to try to show that for the most part those outliers can be explained by taking into consideration some flows of visitors which are not reflected in the raw numbers for Chinese tourists.
First, not everyone who went from Wuhan to Europe for leisure should be considered a Chinese tourist. European tourists could have visited Wuhan and brought the virus back to Europe. But Hubei is not a major tourist destination in China, and Hubei makes up something like 4% of the population of China while Wuhan makes up less than 1%. So this flow of visitors should be minimal compared to the tourist flow on the opposite direction. Even assuming Wuhan is evenly represented in the approximately 3 million Chinese tourists that visit Europe every year, that makes about 2,500 people from Wuhan per month. More on that later.
Second, there are work related visitors and these visitors do not behave in the exact same way as leisure visitors, and do not fit the same profile of leisure visitors. By behaviour I mean who they shake hands with, who they eat and drink with, all of those things we now avoid as part of social distancing. By profile I mean that to a large degree you can assume that Wuhan tourists have more or less the same preferences as other Chinese tourists, and so you can assume that if twice as much Chinese tourists go to European country X than to European country Y it follows that twice as many Wuhan tourists go to European country X than to European country Y.
Work related visitors do not behave that way, mostly because they do not prefer country X over country Y, they have to go to country X because that is where the joint venture partner of their Wuhan company is located, or they have to go to country Y because that is where the supplier/client of their Wuhan company is located. Same thing for Europeans whose client/supplier/subsidiary is located in Wuhan.
So to add this effect to the raw numbers of visitors, we should look at what companies or industries are located in Wuhan and what relationship do they have with European counterparts.
Italy and the Netherlands
I’m putting Italy and the Netherlands together in order to make the article more concise. Wuhan is a major hub for some industries and one of those industries is Optics. The Chinese Optics Valley is home to several important companies in this industry and one of the biggest in Wuhan is Yangtze Optical Fibre and Cable Company Ltd. (YOFC), a joint venture between Italian company Prysmian (through its subsidiary Draka Comteq B.V.) and Wuhan Yangtze Communications Industry Group. Prysmian is headquartered in Milan, with factories in Lombardy (Merlino) and other regions of Italy. Draka Comteq is its Dutch subsidiary acquired in 2010, and it has operations in several locations in the Netherlands: Emmen, Nieuw-Bergen, Eindhoven, Delft. The blue dots mark those locations over a map of current reported cases in the Netherlands per 10,000 people.
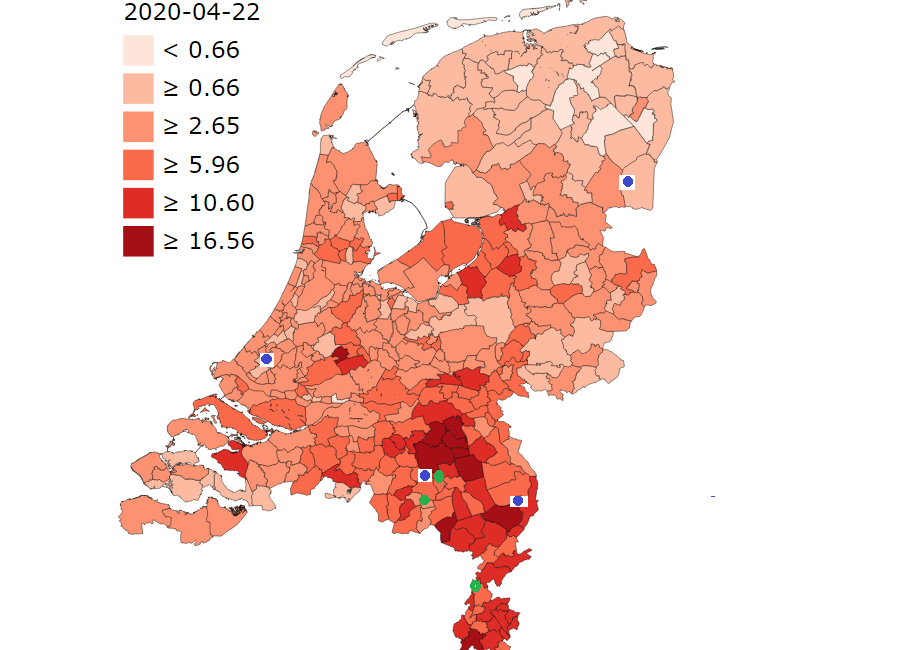
The green dots I’ll explain later. For Italy, these are the locations of Prysmian group, including its headquarters in Milan (blue dots again).
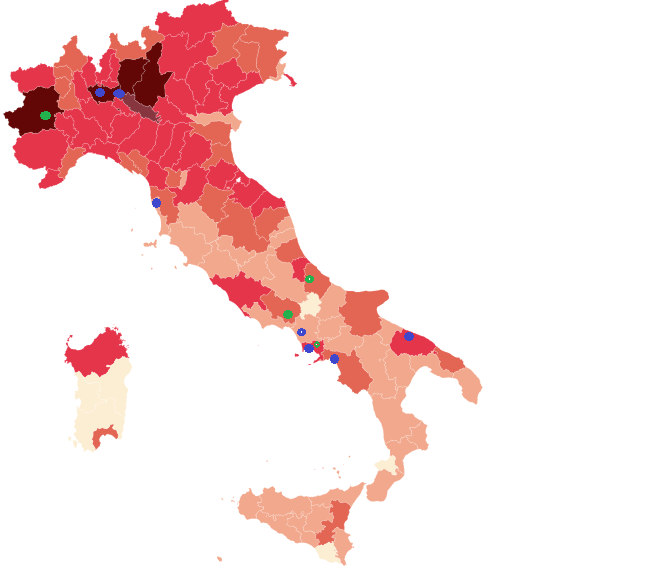
If you think the dots might correlate well with cases in southern Italy but not much with cases in northern Italy, you are right. But going back to those leisure visitors, 4 regions in northern Italy concentrate 72% of all reported deaths in Italy: Veneto, Lombardy, Emilia-Romagna, Trentino-Alto Adige/Südtirol. Those 4 regions also concentrate 42% of all overnight stays by tourists.
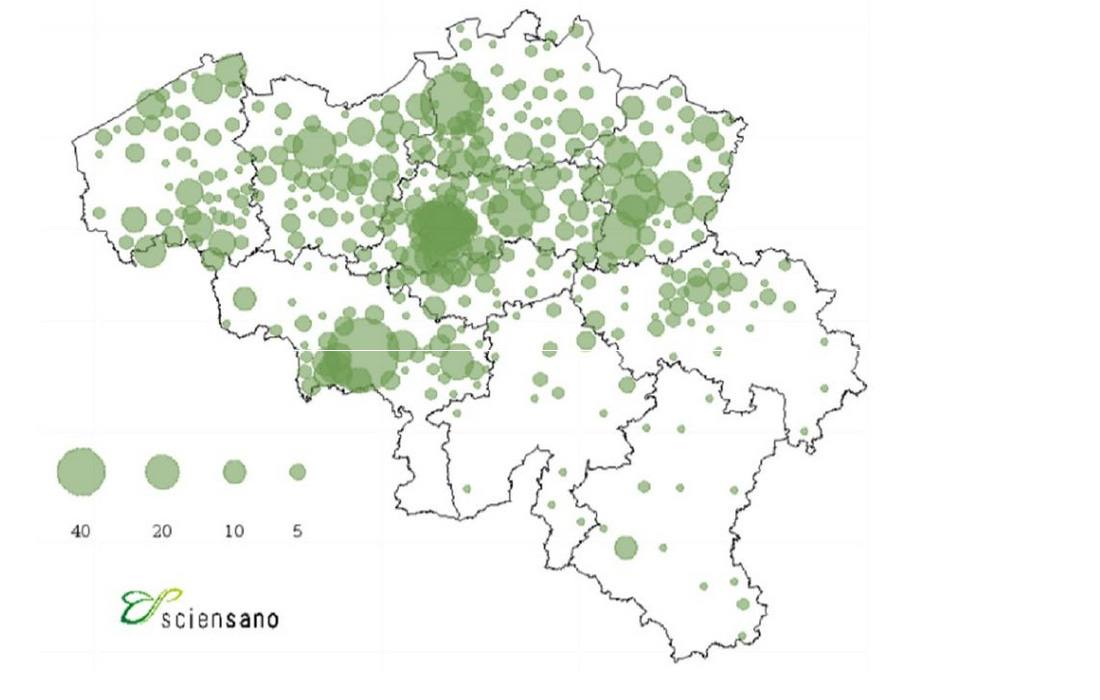
Belgium
The Flanders region makes up 64% of all overnight stays by visitors in Belgium, and 61% (25 March) of all confirmed cases in Belgium. It seems at first sight that the relationship between visitors and cases/deaths holds at the sub-national level in Belgium. For the region of Wallonia less visitors means less cases, except for a few exceptions like the area around the city of Mons, something that seems to have perplexed Belgians.
France
We’ve already seen that France seems to have a predictable number of deaths given its number of visitors, but what about the different regions that compose France.
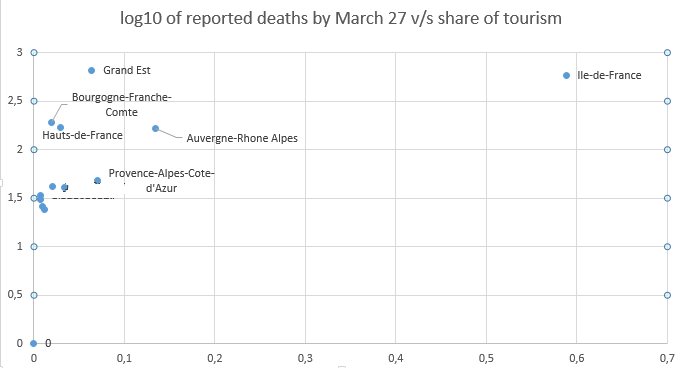
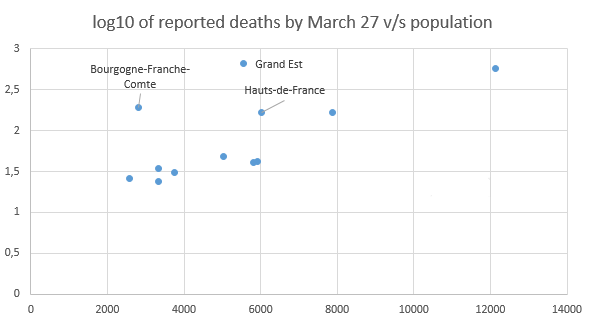
You can see that there are some exceptions to this supposed correlation, the regions of: Grand Est, Hauts-de-France and Bourgogne-Franche-Comté. If we plot log deaths against the population of each region those exceptions seem to hold.
So in order to know what is going on with those regions I’ve made a table (sorry, no map) with deaths per million people by March 27 for all French departements of those regions and some other regions for comparison:
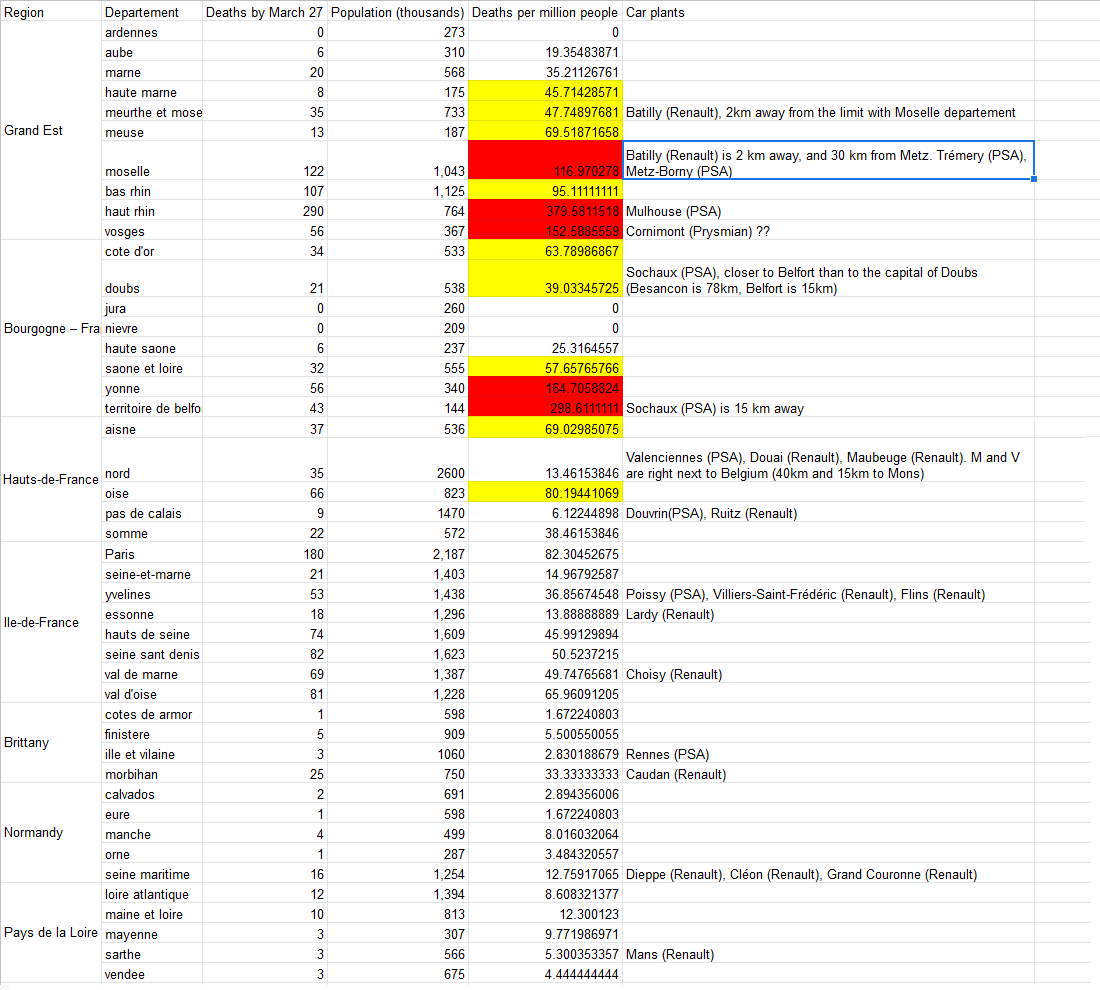
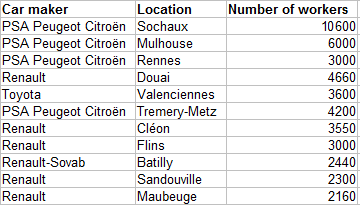
A lot of the exceptionalism (you can call it heterogeneity within France) for each of those regions seems to be due to just a few departements within each region. And for most of those departements (not Yonne though) there seems to be a relation with plants and facilities of PSA (maker of Peugeot and Citroën cars), Renault, and (possibly) Prysmian.
The relationship is not just geographical but also seems to have a “size” component. Sochaux appears to be the biggest factory in France(10,500 workers).
This would seem coherent with bigger plants having more visitors, and a bigger probability of contagion if those visitors came from Wuhan. But why from Wuhan?
Renault and PSA Groupe have joint ventures and commercial alliances with Dongfeng Motor Corporation. Dongfeng Motor is headquertered in Wuhan and seems to have most it’s manufacturing plants in Wuhan. Dongfeng has shares in PSA, buys parts from its partners, shares “talent” with them, etc…
Together with the optics industry of the Chinese Optics Valley, Wuhan’s most important industry in terms of its impact in the world economy is the car industry. And 3 foreign car makers have joint ventures and a large presence in Wuhan: PSA, Renault and Nissan.
Oh, and about the green dots in the map of Italy, one of them is a factory in Val di Sangro co-owned between PSA Groupe and Fiat. The other green dots correspond to other Fiat factories in Italy, and it’s important to remember that besides a long lasting relationship with PSA, Fiat is in the middle of talks about a merger with PSA.
And about the area of Mons in the Wallonie region of Belgium, it happens to be right across the border from the factories in Maubeuge and Valenciennes.
Some mathematics
Let’s go back to those 2,500 visitors from Wuhan per month and do some mathematics.
According to the current narrative 4,512 people have died from Covid-19 in Hubei, 3,869 of them in Wuhan alone. Current estimates for the mortality of the virus go from 0.37% to something like 0.5%. Let’s say our Wuhan visitors actually came from all of Hubei and we’ll get to a number of 1 million infected people at the most. Now let’s assume that in a best case scenario the lockdown in Wuhan was so sucessful that it reduced R0 to 0.5. It’s my understanding that this is a very optimistic value for R0 even under lockdown, and it yields a number of 500,000 infected people right before lockdown.
Now consider a virus that takes 8 weeks (approximately December 1 to January 25) to go from 1 to 500,000 people infected, multiplying the number of infected people by 5.2 every week (this is not R0). This doesn’t take into account the fact that social distancing should have reduced R0 in the days before lockdown.
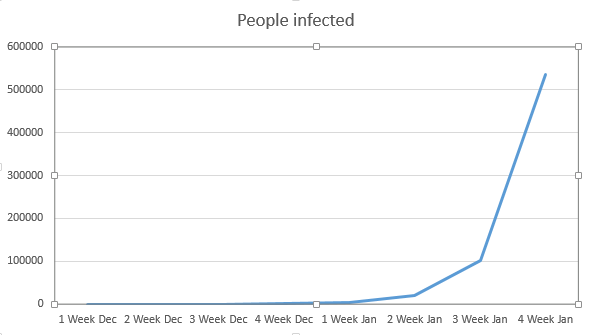
2,500 people make up 0.023% of the population of Wuhan, so if we consider 2,000 people infected for the whole of December that gives us less than 1 infected person traveling to Europe for the whole of December. It gives us 24 infected persons traveling to Europe up to January 18, and 120 up to January 25. On January 23 flights from Wuhan to Europe (3 airports) had already been suspended.
Are 120 people enough to visit most Western European countries, in a manner resembling what would be expected of them given Chinese tourist preferences, so that the epidemic would have its current geographical distribution? What if 60 of them were not tourists but work related visitors? How many of them would have needed to go to Italy for Italy to develop its own outbreak so fast?
Conclusion
I want to end by saying that even if I’m interpreting the data correctly, I see very little implications here for current policy in the fight against Covid-19. This is just an attempt at understanding what happened and how, and trying to start the process of writing the history of this epidemic, something we will eventually do.
I don’t claim to have done any epidemiologial analysis, just brought together the observations that:
It seems implausible that the epidemic in Europe started with a very low number of people (< 10?). Not under the current assumptions about R0, duration of the sickness, time from onset to death, etc…
It seems very clear to me that those who carried the disease into Europe must have gone from Wuhan to Europe for reasons of leisure or work. And if for work related reasons, their behaviour (hand shaking, hugging long time colleagues, being together for long hours in closed environments) would be very different from what you would expect from tourists.
I don’t think there is a large effect of culture, whatever that may mean, in the different outcomes experienced by different countries. I think there certainly must be some effect thanks to different norms of behaviour, but not a large one. I hope to delve more deeply into that in a further article.
I’m not an expert. I have no background in epidemiology or medicine in general. I do work with lots of data often and I’m used to analysing data. I’m also not a native English speaker. I think there’s been a lot of bad reporting on Covid-19, and a have a personal issue with that, in case you were wondering about my motivations.
And some final words on the companies I named. I have presented data which I believe shows how a great part of the differences between countries and regions of Western Europe in terms of Covid-19 cases and deaths can be explained by the flow of visitors between those companies facilities in Europe and Wuhan. I have absolutely no proof that any of these companies was negligent or even complacent when dealing with the virus and the health of their employees. I’ll repeat that. I have NO PROOF of any wrongdoing by those companies. And the fact that they probably took all necessary measures to avoid contagion AFTER knowing about the danger is good enough for me, as I don’t expect them to have taken any measures BEFORE they knew any danger existed. If you are not sure about the dates, please check the Some mathematics section of the article. I know it’s not the easiest (and I’m not the clearest) but you can play with different parameters if you like.
If you think I avoided some subjects or some countries in this article, you are right. I have more data that needs for me to clean it, sort it, and organize it into a more or less coherent article. I intend to publish that as soon as I have the time to do so, and hope to resolve some of the glaring deficiencies of this article.
If you’ve reached this far you might be interested in reading these follow-up articles: