
Is there an effect of culture on Covid-19 spread?
Repost of an old April 2020 article

At the end of my previous article I mentioned how I think there is little
evidence for an effect of culture on the rates of cases/deaths experienced by
different countries in Europe. Now I want to delve deeper on the narrative for the Covid-19 outbreak in Switzerland, Spain, Iran and Latin America. But first I want to say a few words about probabilities in order to illustrate this.
The bean machine
As I said in my previous article, I don’t think the differences in rates of Covid-19 cases/deaths we see are the result of chance, not before lockdowns and social distancing measures were taken. I think those later differences stem from earlier differences, and I think earlier differences (before any testing) were for the most part not the result of chance.
To give you an idea of what I mean by that, think of a series of events that might happen on certain coordinates (X, Y) with a probability P(X,Y). Even random events might follow a known distribution, and so P(X,Y) is a know function wich makes a probabilistic prediction about where any event might happen. This might not be very useful when dealing with a small number of events, but the outcome becomes more and more interesting as you have more events.
You can see this phenomenon using a Galton machine (also Bean machine or Galton board). The beans (or balls) fall through one slit or the other with a probability of 1/2 on each level. The end result is that we know the probability of the beans falling on a certain position X on the bottom level follows a normal distribution.
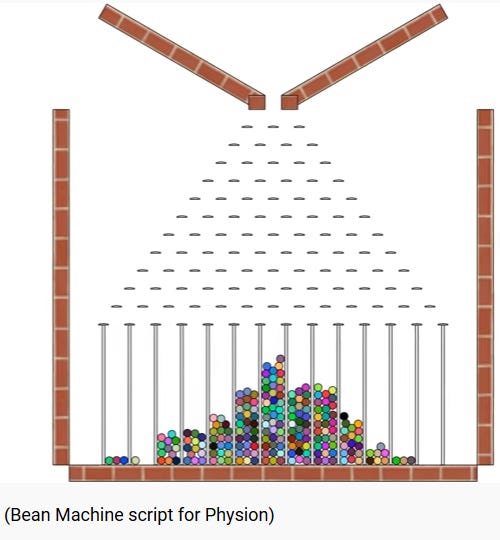
You can see that adding more beans actually produces a real distribution which is closer to the theoretical distribution. And this is precisely what I’ve been trying to examine in these articles.
Now let’s move on to the data.
The data on Switzerland
I’ve seen mentions on social media to the fact that Switzerland would be a good example of a cultural divide explaining heterogeneity (differences in outcomes for the virus) inside a country or between countries.
You can see the same phenomenon on discussions about say Germany compared to Italy and Spain. Teutonic discipline compared to latin touchy-feely-ness and indiscipline.
So this is Switzerland. Cantons are usually identified by a 2 letter code.
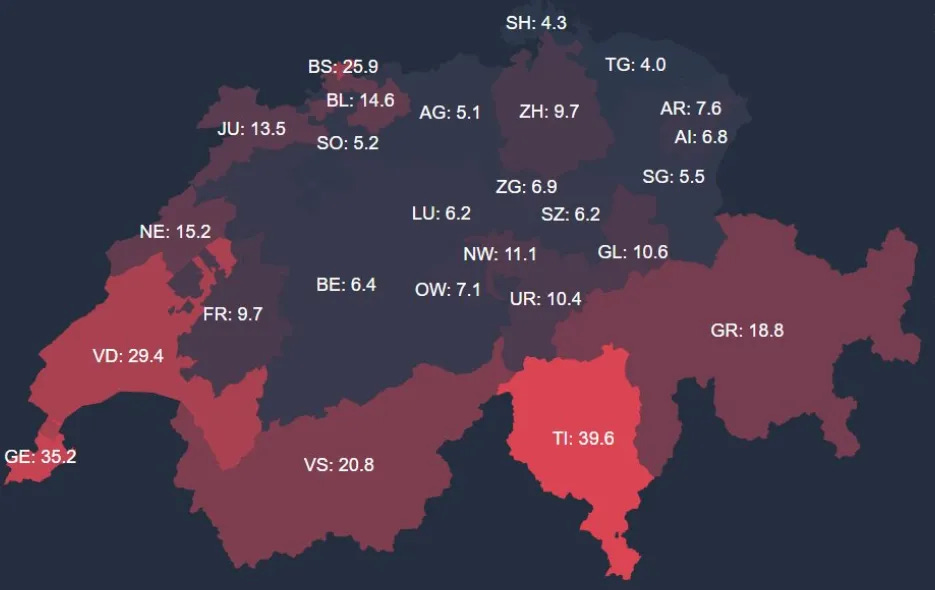
French cantons: Valais (VS, aproximately 2/3 French, 1/3 German), Vaud (VD), Geneva (GE), Jura (JU), Neuchâtel (NE), Fribourg (FR, aproximately 2/3 French, 1/3 German).
Italian canton: Ticino (TI)
“Special case”: Graubünden (GR), which is mostly German speaking (73%), with a little Italian and Romansh.
Valais, Vaud, Geneva and Ticino make up 36% of all overnight stays by foreigners in Switzerland. Graubünden makes up another 14%. So a mostly german-speaking canton has a high CFR which contradicts the cultural explanation but validates the tourism explanation.
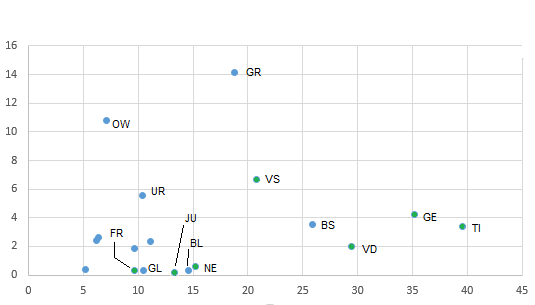
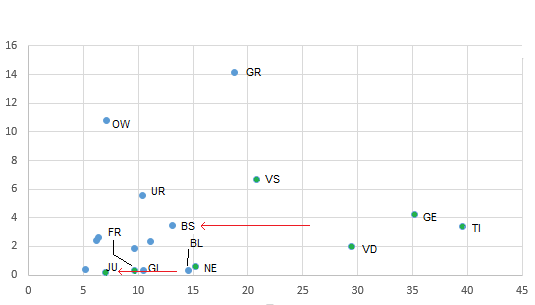
Cantons Jura, Neuchâtel and Fribourg each have around 0.5% of all overnight stays by foreigners in Switzerland, and all three have a much lower CFR than the other (more tourism intensive) french-speaking cantons. I’m going to graph overnight stays per thousand population, as a measure of tourism intensity, against the same values of Covid-19 prevalence per 10,000 population presented before.
If you still think German cantons look like they have a lower prevalence in the previous graph, then Basel-city (BS) seems to be too far to the right. The most simple explanation for that is that Basel is 35 kms away from the French Covid-19 hotspot of Mulhouse.
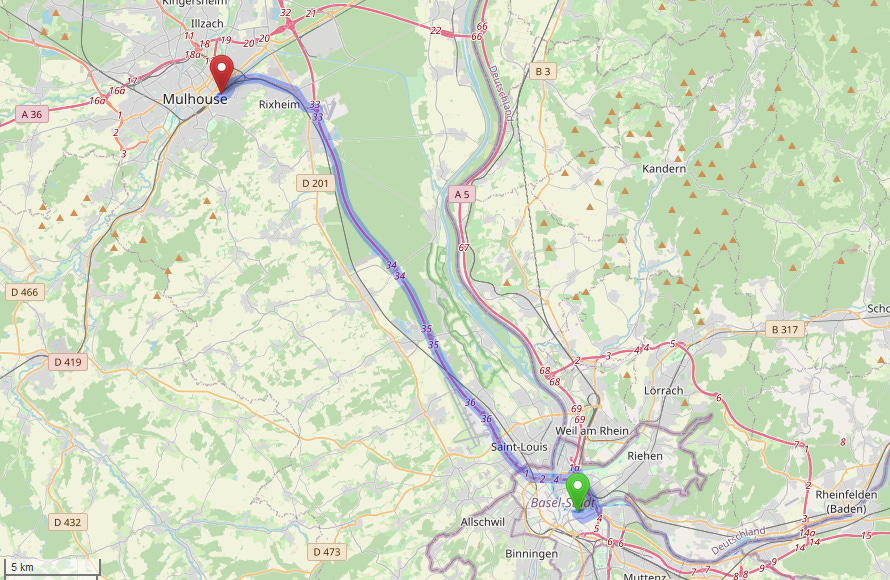
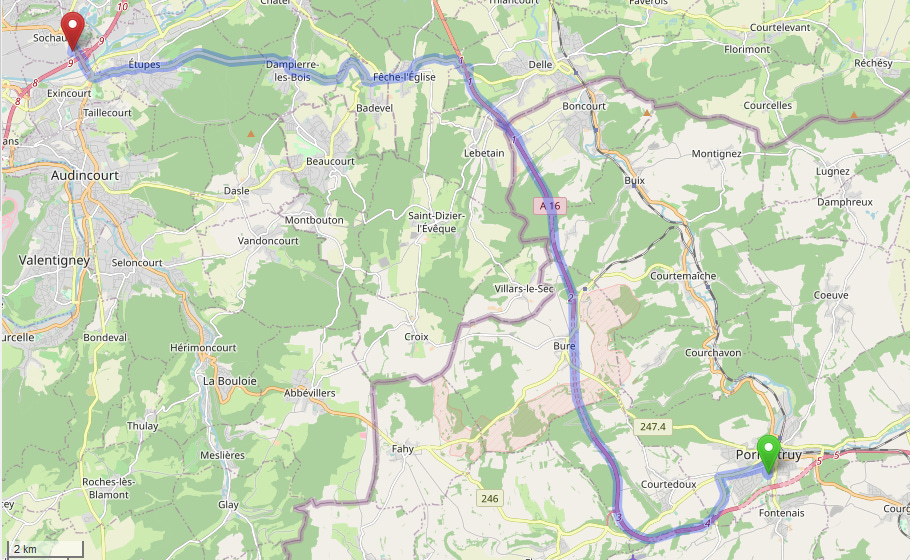
Maybe if it weren’t so close to Mulhouse its prevalance would be lower, say half, so that it would fall in line with the rest of the German-speaking cantons. But then the French-speaking canton Jura (JU) is 31 kms away from the French Covid-19 hotspot of Montbéliard/Sochaux.
This is what the previous graph would look like after adjusting Basel-city and Jura for the influence of the French hotspots.
I don’t think the cultural explanation holds, at least if we are using a simplistic definition of culture being defined by language.
Spain
If you read my first article and saw that first graph of Chinese visitor flows against log10 of deaths by March 25, then you know that by far the worst outlier in that supposed correlation is Spain.
What would be the cultural explanation ? latin temperament? don’t have the discipline to do social distancing?
There was an old Spanish aunt in my family, completely deaf. She would “pat” me on the head but do it with such force as to tilt my head a bit sideways. I loved that aunt. So there, Spanish people are touchy-feely and can’t do social distancing.
This is the same graph I used in the previous article, tourism intensity against log of deaths by March 25, but now using Spanish communities (Comunidades Autónomas).
https://www.datoscoronavirus.es/
That point far away on the right is the Canary Islands, the semi-tropical archipelago in front of the African coast favored by tourists. Now I’m going to remove it from the graph.
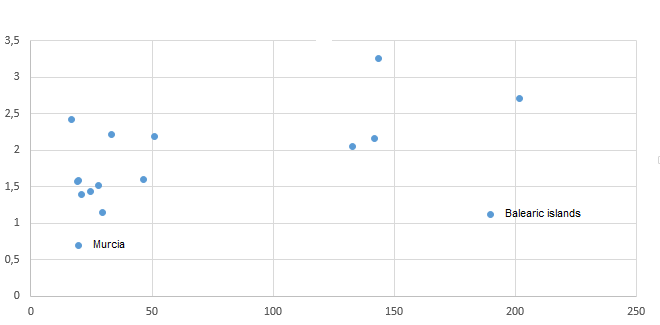
Now I’mgoing to remove the Balearic islands and Murcia because the weather is just too nice at those places.
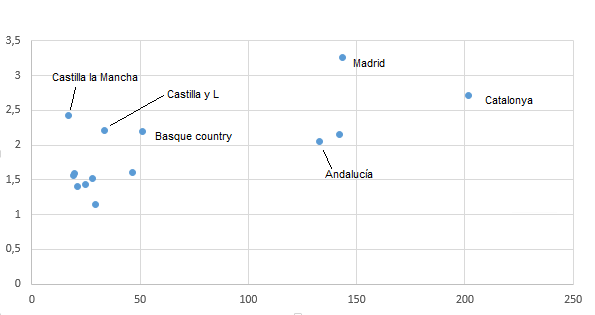
There are still clear outliers in the resulting graph, even after having taken out the places with the nice weather: Castilla la Mancha, Castilla y León, and especially Madrid.
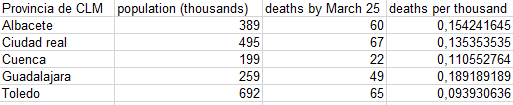
In the case of Castilla la Mancha, the most affected province is Guadalajara, less than 60 km east of Madrid.
And from the press (can’t find good local data for Madrid), it seems to be a spillover effect because the most affected area of Madrid is its eastern zone.
Now I’ll present the same first graph of the previous article but considering only deaths and visitors outside of Madrid and the Canaries for Spain.
It still looks bad, but no so bad as before. I think that Spain’s exceptionalism, the fact that it is an outlier, is for the most part the product of Madrid’s exceptionalism.
Iran
You might recall that besides the “normal” tourist flows of people from Wuhan I emphasized work related flows, not just because they distort what the tourist flows from Wuhan measured using all of China as a proxy say. Also because the flow of Chinese nationals from Wuhan to country X (and maybe region Y) should probably be complemented by a flow of nationals from country X (and maybe region Y) to Wuhan.
As I mentioned in my previous article, after the sudden outbreak of Covid-19 in Iran several versions as to how the virus might have arrived in Iran and who was the index patient begin to circulate on the media. Some of those versions mentioned a merchant from the city of Qom, where the virus was first reported, while some others told a different story.
The scenario I imagine when told of an Iranian merchant who travels frequently to Wuhan is of someone buying all kinds of assorted Made in China products to be sold in colourful bazaars. Your own mental picture may vary from this, but in order to verify the plausability of those scenarios I want to take a look on trade between China and Iran. Assuming a certain portion of whatever is being traded between Iran and China is actually being traded between Iran and Wuhan (should be something like 1% to 4%), looking at those numbers might be illuminating. I’m leaving out trade in oil because it represents a big part of total trade but should have no incidence on the flow of merchants from China to Wuhan and viceversa.
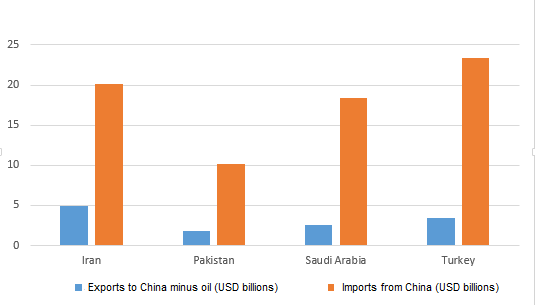
I’m aware that the numbers I’m using for Iran are not very reliable due to sanctions and the effect they might produce for the period of time I’m trying to focus on (few months before the outbreak), but most of the variation between sources and years seems to be on the value of exports, as would be expected, not on the value of imports. And I think the scenario I described represents mostly the case of imports from China.
Given those numbers why didn’t that same scenario happen in Saudi Arabia, Turkey or Pakistan?
I know that the merchant version is just one version of how the virus got so fast (or early) into Iran, but I wanted to show the unlikelihood of that scanario before proposing the one I think is more likely.
If you read my previous article you might remember I mentioned the relationship between PSA and Renault with Wuhan based car maker Dongfeng Motor. Another car company which has a very close relationship with Dongfeng Motor is Iran Khodro. And that relationship also extends to Peugeot and to Renault.
It would be hard to get good enough data to show Teheran having a larger than expected share of infections/deaths in Iran, and the first cases of the Iranian outbreak were reported in Qom. All I can show in terms of data is that the official deaths don’t match, the outbreak seems too sudden and points in the direction of the virus having arrived in Iran much earlier than has been reported, and having enough time to spread from Teheran to Qom which is only 140km away. I mention Teheran because it’s the seat of the largest Iran Khodro factory and headquarters of the company.
Out of the other 6 factories of Iran Khodro the only one that stands out is the one on Semnan province for 2 reasons. Semnan is the smallest of the provinces where Iran Khodro factories are located and thefore it’s probably the best candidate for showing signs of an outbreak if that outbreak was caused by the normal flow of people from Dongfeng (Wuhan) to Teheran, and from Teheran to some other Iran Khodro factories. By March 20 the reported number of cases per million people was 292.5 for the whole of Iran, and 349.8 for Teheran province. On the same date it was 1,290 for Semnan province, way above what you would expect if the outbreak spread from Teheran in a random manner.
Latin America and Brazil
Yes, I know that Brazil is part of Latin America, but sometimes they seem to be so different, speaking their own language and all.
Let’s see some numbers on how different Brazil looks compared to the rest of Latin America from the point of view of Covid-19.
Note: I know I’ve been using deaths reported on March 25 for my previous articles on Western European contries, but since Covid-19 reached Latin America later I think we can get a better picture by using more recent numbers.
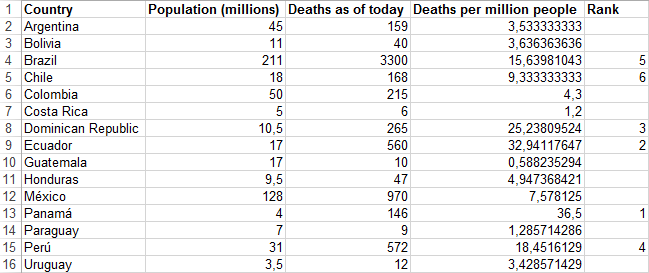
Brazil is the fifth country with more deaths per million people in that table, only Panamá, Ecuador, the Dominican Republic and Perú having more deaths per million. Is there some relation between those countries?
According to some reports visitors to Latin America from China amount to 200,000–300,000 annually, which would mean something on the range of 16,000–25,000 per month. If we assume the same probabilities that I mentioned in my first article for some of them being from Wuhan and some of them being infected, that means a very small chance of an infected Chinese tourist arriving in Latin America and spreading the virus there.
That seems to be in agreement with the current narrative for Covid-19 in Latin America. For most countries it’s been reported that the index patient came from Italy or Spain, not China. But what if we focus not on tourists but on work related visitors and VFR (Visiting Friends and Relatives) visitors.
Panamá and Perú seem to have by far the largest Chinese communities in Latin America (6% and 4% of their total population respectively). Those communities began to form decades ago, more than a century ago in the case of Perú, and they seem to keep a strong relation with China. At least that’s been my personal experience in the case of Panamá (corrections are welcome).
That kind of relation might also explain why Tijuana in México has by far the highest rate of deaths per million people of any Mexican state, with 49 deaths per million. Second is Mexico city with 34.5.
That brings me back to Brazil. Tijuana has the largest Chinese community in México and is one of the few cities with a direct flight to China. Yet the effect of that gets averaged out when looking at the numbers for México. Since Brazil is even larger than México, could it be possible to find something interesting by looking at the numbers for each Brazilian state?
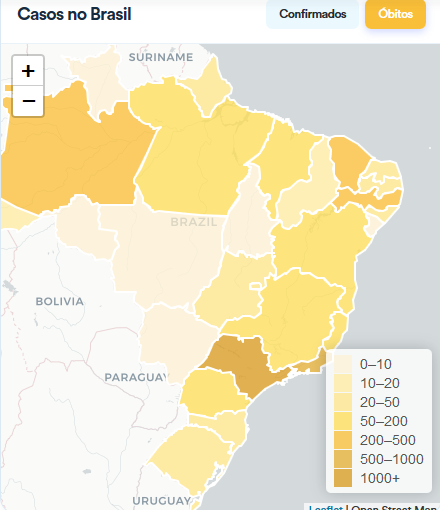
This is a map of deaths per Brazilian state.
https://covid.saude.gov.br/
Some states seem to stand out from the rest. Ceará and Pernambuco are the darker shaded states in the northeastern region (Nordeste). Sao Paulo and Rio de Janeiro are the two darkest ones (but this is a statistic for absolute deaths, not deaths per population), and that might be expected considering they are two of the three most populous states. Amazonas is the big one to the left, stradling the Amazon basin, and that is a bit unexpected for a less populated place that would seem more isolated from Brazil and even the rest of the world.
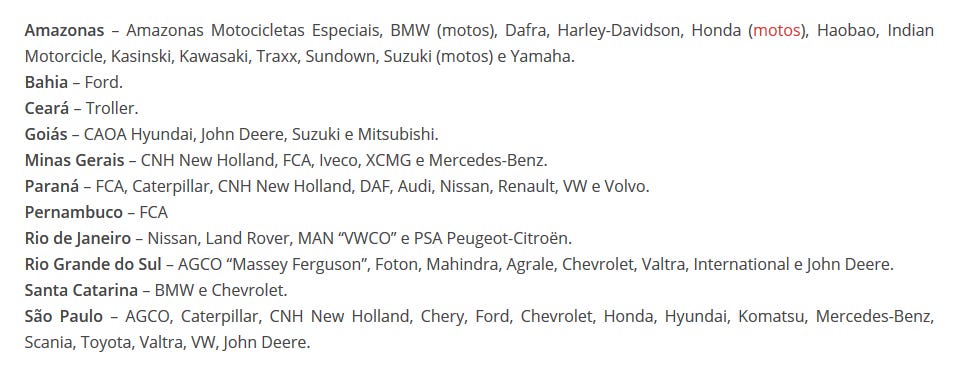
Now look at this list of vehicle manufacturing plants for Brazil.
Taking that list as a base I cleaned it and checked the characteristics of plants in order to make them comparable, and here is the result of graphing the “clean” number of plants vs log10 of deaths for each state.
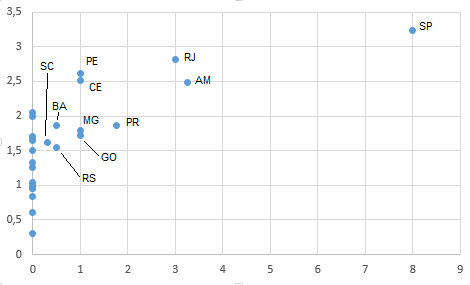
I don’t want to clutter this article with the details of how I cleaned the list of manufacturing plants, but you can check those details at the end of this article under the title Brazilian vehicle manufacturing plants. You should always distrust a graph that looks nice. Keep in mind that my goal for cleaning that list was to represent as much as possible the actual headquarters or offices of the different manufacturers, because those are the places the virus should have reached first.
If you’ve read my previous articles you probably think that I’m suggesting Brazilian car manufacturers were exposed to the virus either directly from Wuhan or indirectly (through PSA or Renault). That would be possible, but I think there is something deifferent about Brazil. The fact that the distribution of deaths seems to follow closely the location of offices and plants of Brazilian car manufacturers seems to imply that there’s a Brazilian factor, something that ties all (or almost all) Brazilian manufacturers together.
A good candidate for this place/event would be the São Paulo International Motor Show, but it took place during last November way before it would have been possible for a visitor to bring the virus from Wuhan. Or at least that is what the current narrative says.
Conclusion (sort of)
I hope to have persuaded you that culture plays a much lesser role in the spread of the virus as has been publicized, considering how cases for Switzerland and Spain don’t seem to follow that pattern. And I hope to have persuaded you a little bit more about the role of work related visitors.
If you’ve read both of my articles I want to thank you for your patience. I’ve tried to show as much data as possible to back up my claims, and I want to assure you that yes, there is a clear conclusion I’m trying to get at and I’m going to state that conclusion in my next article.
Brazilian Vehicle manufacturing plants.
I’ll restate that my goal in cleaning the list of manufacturing plants was to get to a list representing mostly the headquarters and main offices of each manufacturer/brand. Only after that, and to a leser degree, the list should represent the locations of actual manufacturing plants. The reason for this is that I assume the virus must have spread first to offices or headquarters of the different manufacturers, and only later might have been spread to manufacturing plants.
This is what I did with the list of plants. I took John Deer, DAF, XCMG, Valtra, MAN VWCO, AGCO “Massey Ferguson”, Komatsu, Foton, Agrale, International, Iveco, Volvo (trucks and buses), Mahindra (tractors), Mercedes Benz in Minas Gerais (trucks) and Caterpillar plants off the list because they make only trucks, buses or tractors.
FCA factory in Paraná, VW factory in Sao Paulo, and Chevrolet factory in Santa Catarina manufacture just engines. So I took them off.
Nissan in Paraná appears to be the same as the Renault factory, so I took it off the list. The Nissan factory in Rio de Janeiro is actually where Nissan Brazil is located, with headquarters in Rio de Janeiro and factory in Resende.
For Audi Paraná I counted only 0,25 of a factory because it’s much smaller than the rest. For Ford Bahia I only counted 0,5 of a factory because it’s not the main Ford location in Brazil. I counted both factories in Goias as 0,5 because both seem to be owned not by the brand (Chery/Hyundai, Suzuki/Mitsubishi) but by a third party on contract. For VW Paraná I only counted 0,5 of a factory because it’s not the main Ford factory in Brazil. For BMW Santa Catarina I counted only 0,3 of a factory because it’s much smaller than the rest. For Chevrolet Rio Grande do Sul I only counted 0,5 of a factory because it’s not the main Chevrolet location in Brazil. I applied a factor of 1/4 for all the motorcycle factories of Amazonas.
And this is a table with some data for some of the factories in case you want to check.
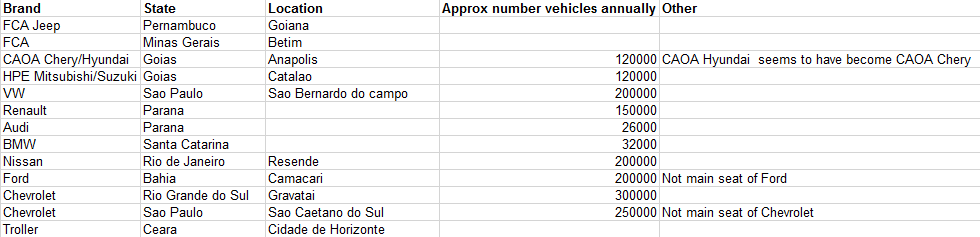
From the point of view of the list of states I amalgamated Goias and Distrito Federal since the Brazilian Distrito Federal is completely surrounded by the state of Goias.