
Another paper (and tweet) claims that 1950s Cuba was "near the top" of Latin America...
And again, I dispute the claim that Cuba was ahead of most of Latin America around the time Castro arrived in power.

When I wrote my July 2024 post questioning the claim that before the Cuban Revolution the Caribbean country was a leader among Latin American nations in terms of development, I did wonder whether I was yelling at clouds by answering to a 2016 (that’s old!) post by Bradford DeLong. Maybe my perception that well-informed and apparently smart people were still repeating this claim was outdated.
That’s until a few days ago, when I encountered this tweet by George Mason University economist Vincent Geloso (who seems very smart and well-informed):
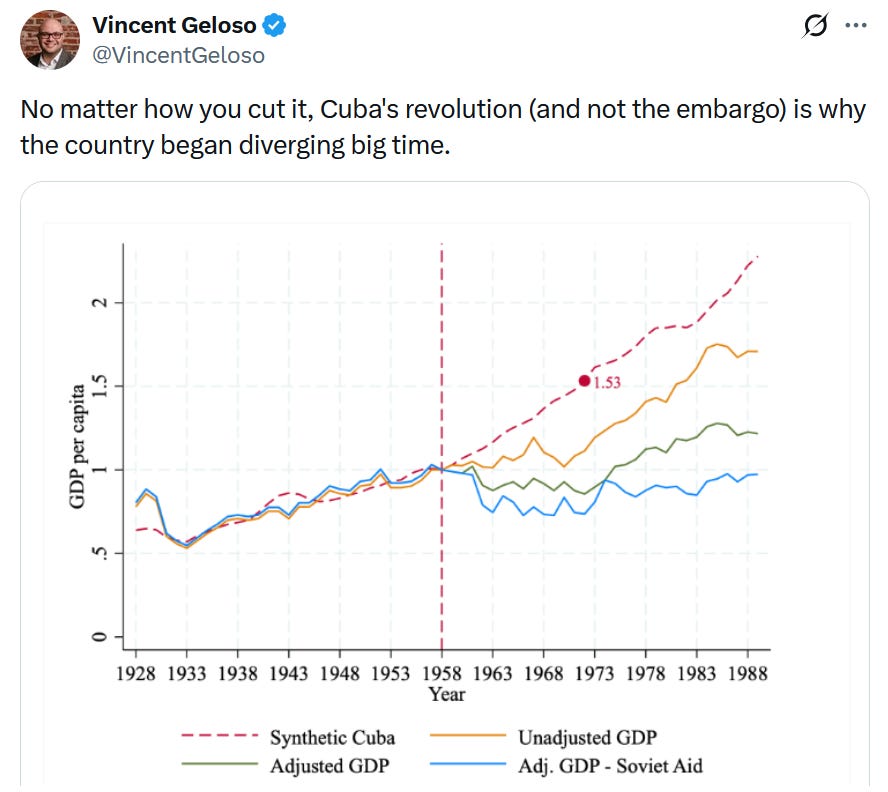
The tweet refers to a 2025 paper by Geloso and Jamie Bologna Pavlik which uses a clever econometric method, synthetic controls, to estimate what the trajectory of Cuban per capita GDP could have been absent the 1959 Revolution, and concludes that the main cause of Cuba’s current poverty is not the American embargo but revolutionary policies.
I have no issue with the paper in general, but I have an issue with this paragraph from the paper’s A.1 appendix “How Rich was Cuba Pre-1959“ which attempts to provide context on Cuba’s economic history:
By 1913, this was no longer the case, as [Cuban] income per head had reached approximately 60% of the level observed in the United States. By 1925, Cuba’s income per capita placed it roughly on par with America’s poorest states (e.g. Alabama, Mississippi). Nevertheless, this remained higher than in all Latin American countries except Argentina, which stood at 80% (Bulmer-Thomas, 2003, p. 492). By the mid-1950s, this relative position persisted (Bulmer-Thomas, 2003, p. 331). Other development indicators—such as car, television, and radio ownership, infant mortality, life expectancy, and literacy—also placed Cuba near the top, at times rivaling European levels (Ward and Devereux, 2012, p. 115)… In other words, no one disputes the claim that Cuba was ahead of most of Latin America around the time Castro arrived in power.
I’m now going to pedantically review each phrase in that paragraph, and dispute Geloso and Pavlik’s claim.
(I shouldn’t need to say this, but given that the only like my tweet/response to Geloso received came from someone who commented “people don’t eat GPD…Cubans are free, americans are slaves“, here it goes: the goal of both this post and the previous one is to place Cuba’s supposed pre-revolutionary (relative) prosperity in the proper perspective. Arguing for a correction of estimated pre-revolutionary living standards downwards SHOULD NOT BE TAKEN as an argument in favor of the Revolution, just like arguing for a correction upwards should not be automatically interpreted as an argument against the Revolution. I do not have a Fidel Castro or Che Guevara poster on my wall)
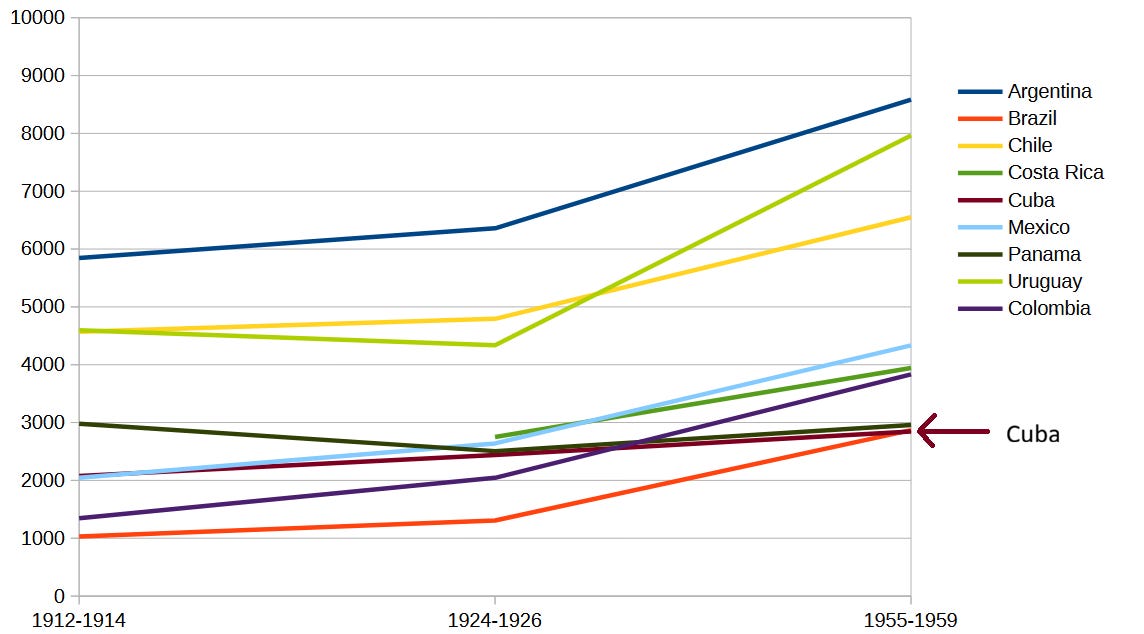
Let’s start with the first sentence. Regarding Cuban per capita income in 1913, it wasn’t even close to 60% of U.S. levels. In fact, it was roughly 21% of American income, very similar to Mexico’s, as you can see in the following chart.
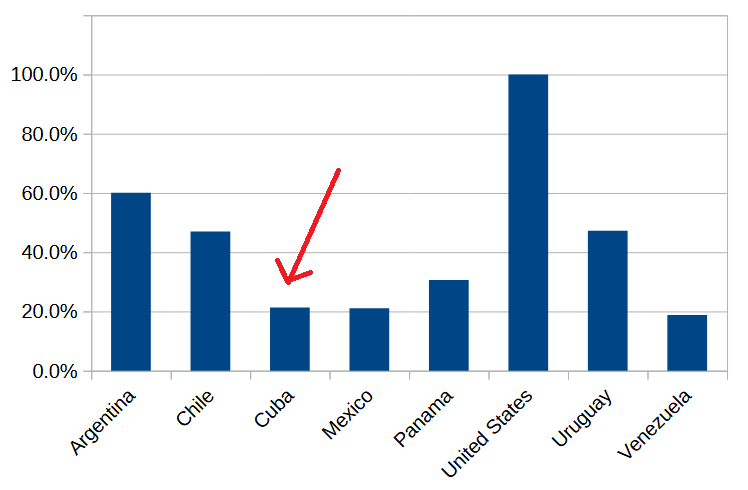
By 1925, the picture hadn’t changed much. Cuba’s per capita income was still close to 21% of that of the U.S. level, roughly in the same range as four other Latin American countries: Mexico, Venezuela, Costa Rica and Panama (which actually saw a substantial relative drop from 1913 to 1925).
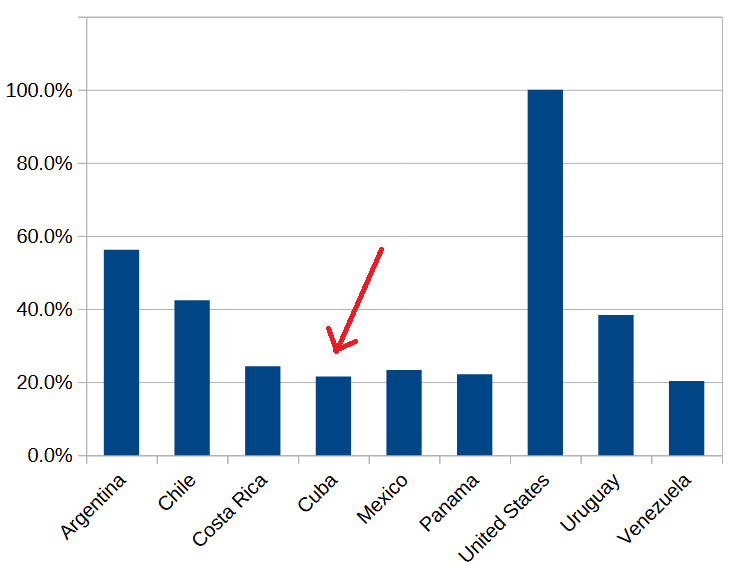
The gap between the American average income and Latin American incomes in the 1920s was so wide that even Argentina, the wealthiest country in the region, reached only around 60% of the U.S. level (not 80%), slightly above the states of Alabama and Mississippi.
Other indicators
When commenting on other development indicators, Geloso and Pavlik cite (in addition to Ward and Devereux) Xavier Tafunell’s 2007 article “On the Origins of ISI: The Latin American Cement Industry, 1900–30“, mentioning that, according to Tafunell “Cuba was also responsible for one quarter of Latin America’s capital formation in machinery and equipment in 1920“. This is not correct. Tafunell (2007) does not say anything of the sort.
I’m glad the authors cited Tafunell (2007) though, because reading that paper allowed me to gather statistics on early 20th century cement production for several Latin American countries, including Cuba. Tafunell collects production data only up to the year 1929, but thanks to the United Nations’ 1959 Statistical Yearbook we can supplement Tafunell’s data with late 1940s and 1950s data. With this longer data series we can compare relative cement production levels across countries and examine historical trends.
Here’s a chart of per capita cement production in several Latin American countries based on the UN’s and Tafunell’s data.
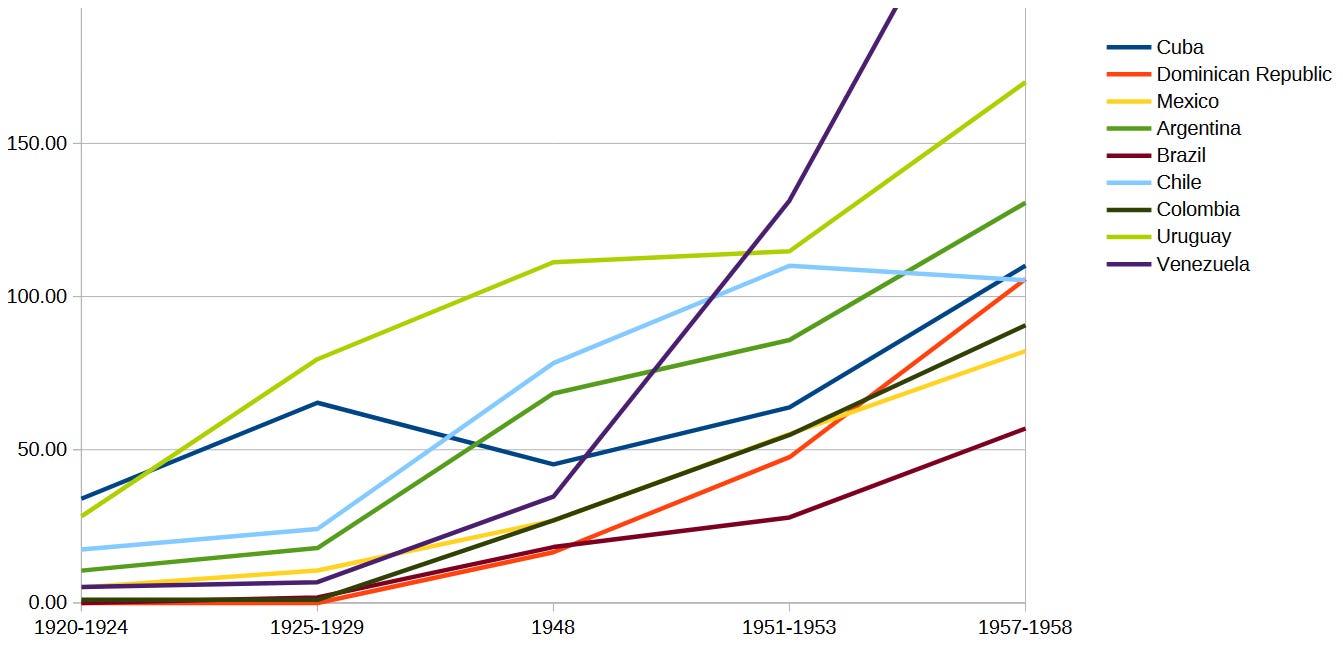
Notice that Cuba (blue line) starts out with an exceptionally high level of per capita cement production in the 1920s, only to end up in a better-than-average but unremarkable position by the 1950s, on the eve of the Revolution. By 1957-1958, Cuban production was roughly on par with that of the Dominican Republic, a country no one would describe (am I sure?) as having been “near the top” in 1950s economic indicators. More on this later.
Near the middle of the paragraph, Geloso and Pavlik seem to imply that by the mid-1950s Cuba’s per capita income “remained higher than in all Latin American countries except Argentina“. I have three issues with this claim:
I can’t find any statement in Bulmer-Thomas’ book (searched from pages 329 to 333) saying that Cuba had the second-highest Latin American income in the 1950s1.
As I’ve shown in the previous charts (1913 and 1925), Cuban per capita income in the early 20th century was not higher than Uruguay’s, and very likely not even higher than Chile’s. It was not the second-highest.
This last point is not that important. What is far more important though, is that Cuba’s relative income position did not remain the same in the 1950s as in the early 20th century.
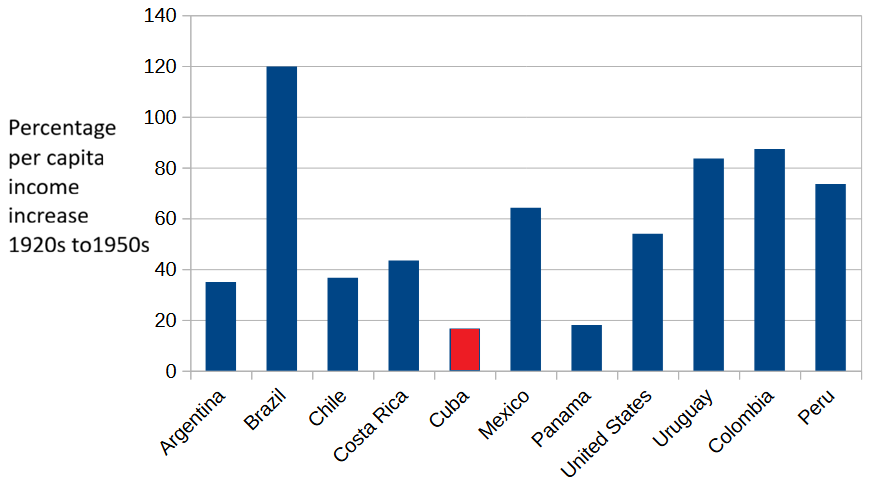
This third point is illustrated in the following chart: while many Latin American countries significantly increased their per capita income between the early 20th century and the 1950s, Cuba’s income barely grew around 40% (incomes measured in constant dollars). The only other country in the sample with a similarly disappointing performance is Panama.
This is similar to the trend we saw in the cement production chart. You could say that Cuba began the century “near the top”, yet by the 1950s its economic indicators are no longer among the Latin American leaders, with many countries rapidly closing the gap or even surpassing Cuba.
UPDATE: The previous chart was not clear enough, so I’ve now created a bar chart showing the increase in per capita income from the second period (1924-1926) to the third period (1955-1959). You can clearly see the very disappointing performance of Cuba in this chart.
The deaths of infants and the death of credible statistics
Let’s move on to the last sentence in the paragraph: “Other development indicators—such as car, television, and radio ownership, infant mortality, life expectancy, and literacy—also placed Cuba near the top, at times rivaling European levels (Ward and Devereux, 2012, p. 115)“. Regarding infant mortality, I’ll quote myself (sorry about that):
Not only is the 38.9 death rate declared as unreliable, but we now have an explanation for the marvelous Cuban rate: the rate was calculated excluding live-born infants dying within 24 hours of birth. The only rate Cuba reported to the United Nations can’t be compared to other countries’ rate, and is significantly lower than the real infant mortality rate.
I didn’t try to estimate Cuba’s true infant mortality rate in my previous post, but I’ll give a try now. In Cuba, all infant deaths within 24 hours of birth were as stillbirths, so knowing that reported yearly stillbirths ranged between 6,500 and 5,500 in the years 1938-1949, we can try to estimate how many of those are “excess” stillbirths, assuming we know what the expected number of yearly stillbirths is, of course2.
My rough estimate, based on the stillbirth numbers from other Latin American countries is 2,500-3,000 expected yearly stillbirths in Cuba3. This would imply around 3,000 “excess” stillbirths. Next, we need to divide these excess stillbirths by the total number of births. Well, this is problematic.
During the 1938-1949 period, Cuba’s number of reported yearly births varied wildly, from 69,492 to 174,526 (maybe I should write a post trying to square a country’s inability to properly record births with a high rate of car and radio ownership…). Taking the second-highest number of births (148,917 births in 1949) yields roughly 20 excess stillbirths per 1,000 births. And adding that number to Cuba’s reported infant death rate produces a “corrected” infant death rate of around 60 per 1,000.
I don’t trust that number. But it at least gives a rough idea of how distorted the 37-38 rate is, and it puts to rest the claim that Cuba had a lower infant mortality rate than many European countries in 1950s.
Regarding life expectancy, there are three different sources, none of which provide data on Cuban life expectancy during the 1950s4.
The first source is the Economic Commission for Latin America and the Caribbean (CEPAL), cited in Felipe Sixto’s “An Evaluation of Four Decades of Cuban Healthcare” (2002), who’s in turn cited by Ward and Devereux (2012), who are in turn cited by Geloso and Pavlik (G and L). The second source is the Cuban Health Ministry (MINSAP), also cited by Felipe Sixto. And the third source is the UN’s 1970 Demographic Yearbook.
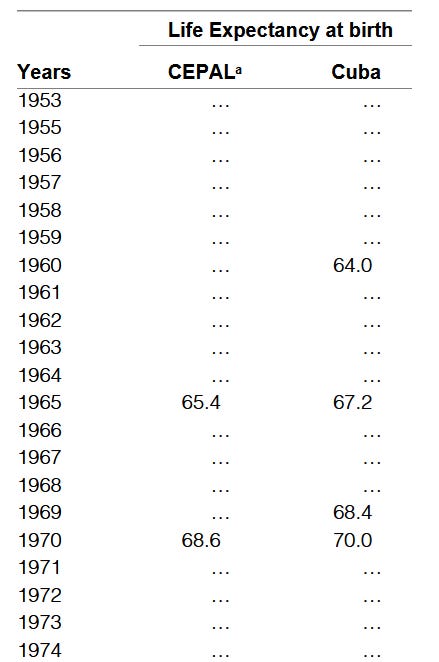
You can see the figures from CEPAL and MINSAP here:
Notice three things:
The first MINSAP figure corresponds to the year 1960 (and it happens to be a round number).
The life expectancy estimates from CEPAL and MINSAP do not coincide: MINSAP figures are higher.
The MINSAP numbers suggest a sharp increase in life expectancy of 1.6 years between 1969 and 1970.
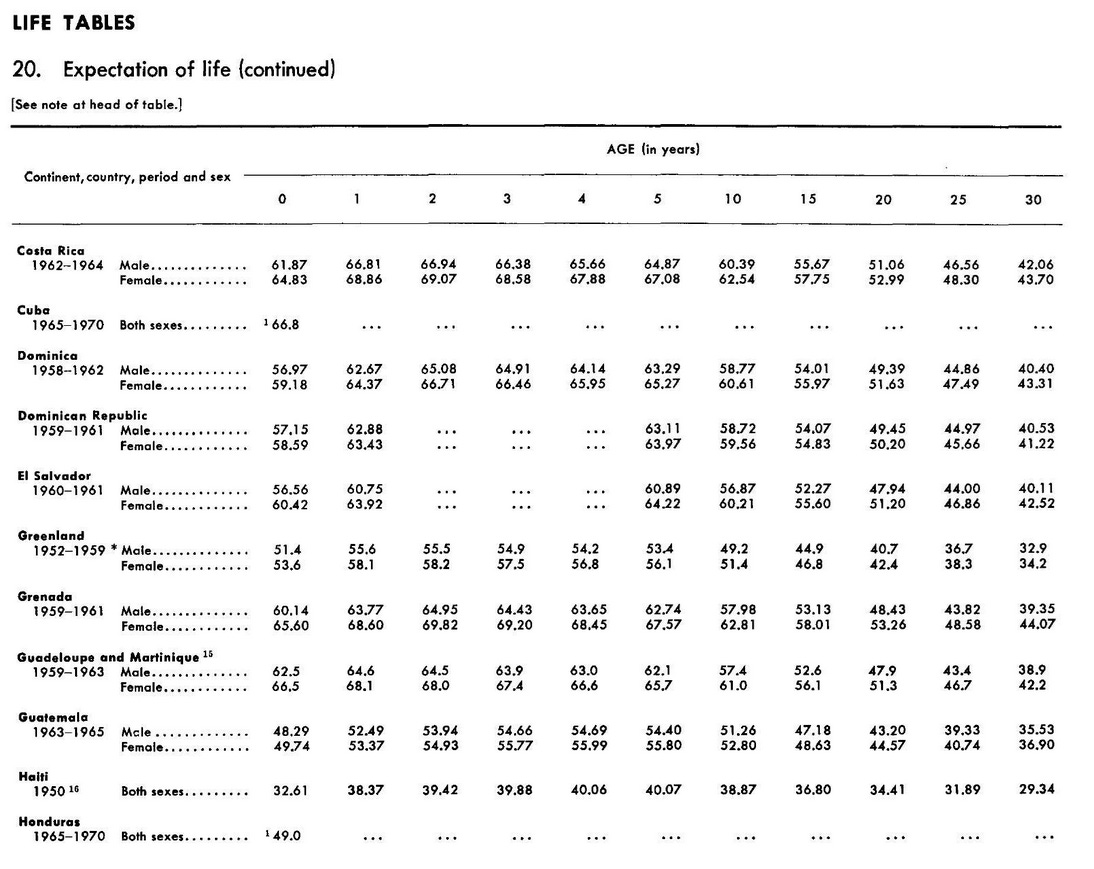
Before drawing any conclusions from these numbers, let’s take a look at the figures from the third source, the Demographic Yearbooks. Life expectancy data was published in most UN Yearbooks since at least 19625, yet no figures for Cuba appear in any Yearbook edition until 1970. The 1967 Demographic Yearbook in particular includes not only the latest life expectancy figures for all available countries, but also historic figures. There was no historic life expectancy data for Cuba at the time.
When the first life expectancy figure for Cuba is published, in 1970, it’s just an estimate produced by the UN’s Population Division, not a figure reported by the Cuban health system. And it lacks a breakdown by age cohort or by sex.
The only other Latin American countries for which the UN Population Division had to provide a rough life expectancy estimate were Honduras, Nicaragua, Paraguay and Brazil (though Brazilian data was published in the 1962 Yearbook). All of these countries, except Brazil, were at the bottom of the regional development scale at the time.
If we compare the UN’s 1965-1970 estimate of 66.8 years to the MINSAP and CEPAL figures, it does seem to match CEPAL’s 1965 estimate of 65.4 years (roughly, most underdeveloped countries increased their life expectancy at a rate of 3 years every half decade during that period). What it does not match, are the MINSAP’s 1960 or 1965 figures, which seem consistently inflated6. We can now calculate a 1950s life expectancy estimate, based on CEPAL and the Demographic Yearbooks.
The blame for misrepresenting life expectancy in 1950s Cuba does not lie with Geloso and Pavlik, but rather with Ward and Devereux (2012), who claim that “Life expectancy at birth, circa 1955 was 64 years in Cuba“ citing the same sources we’ve just examined. This is simply wrong. The most likely figure for Cuba around 1955 would be 58-60 years, putting Cuba on par with Costa Rica.
This is good, but not exceptional, and clearly lower than European levels at the time7.
Read the trend
The illiteracy data supporting Geloso and Pavlik’s claim that Cuba “placed… near the top, at times rivaling European levels“ comes from Ward and Devereux, who in turn use the MOxLAD (OXLAD) Database of Latin American statistics as their source8.
And I have to agree that illiteracy in 1950s Cuba was very low by Latin American standards, around 21% in 1955, placing it near the top of the region.
But I do take issue with the claim that Cuban literacy rivaled European levels (CAVEAT: maybe G and L meant European levels of radio ownership, car ownership, etc… but not literacy). I also have an issue with the implication that Cuba’s low level of illiteracy indicates the country was doing great in the 1950s.
First, let’s look at Europe. The 1964 UN Statistical Yearbook is the first edition to include illiteracy rates9, and even though its sources appear to be the same as those used by MOxLAD (reported rates for Latin American countries mostly match), there is no Cuban illiteracy data in that Yearbook10. So, assuming rates are comparable between both sources, how does Cuba fare compared to the few European rates provided by the Yearbook?
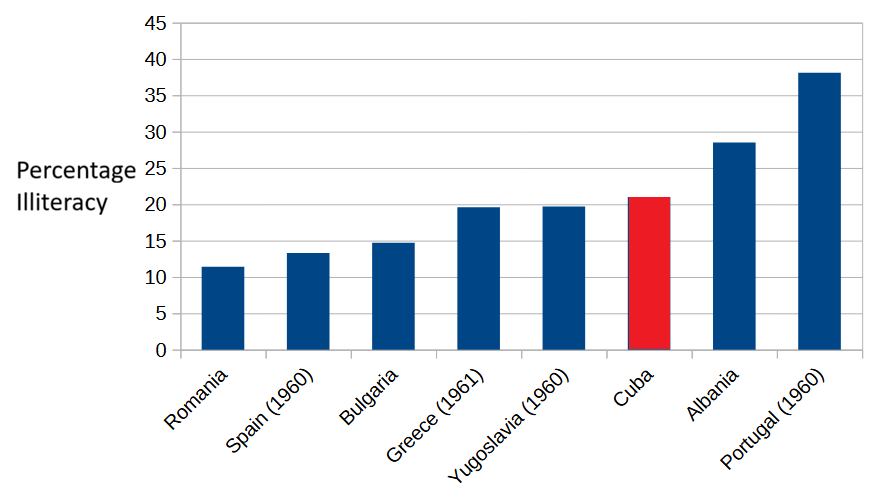
You can see that Cuba’s literacy rate was higher than those of Albania and Portugal11, and comparable to those of Greece and Yugoslavia12. We can safely assume that nearly every other European country not in the above chart had illiteracy rates below 10%13. Cuban literacy did not rival European levels.
The second point I want to make about Cuban literacy, relates to the cement production and income trends we saw above. You could say that newly independent Cuba in 1898 “inherited” a relatively high literacy rate from Spain, and if so, its position near the top of Latin America in 1910 or 1920 should not be surprising.
But how was it doing by the 1950s?
Most Latin American countries were rapidly reducing illiteracy during the mid-20th century, as you can see in the following table from Rosemary Thorp (1998).
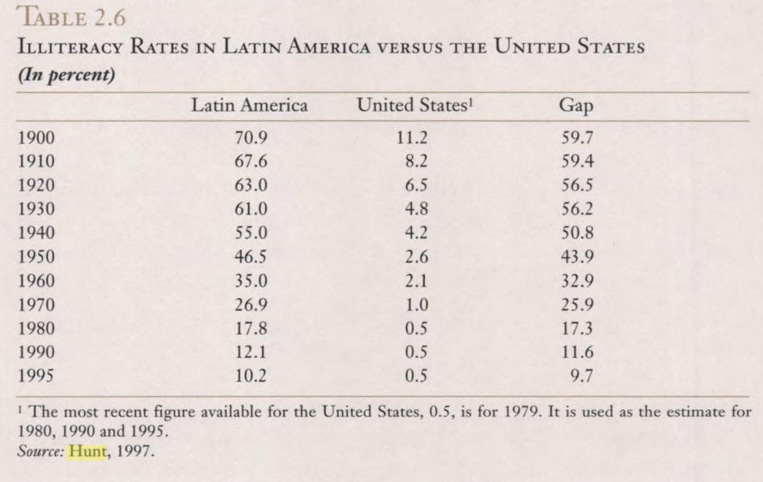
And the biggest drop in illiteracy happened from 1950 to 1960: 11.5 percentage points in a decade.
Now, let’s look at the trends in illiteracy rates during the early and mid-20th century in Cuba and its peers.
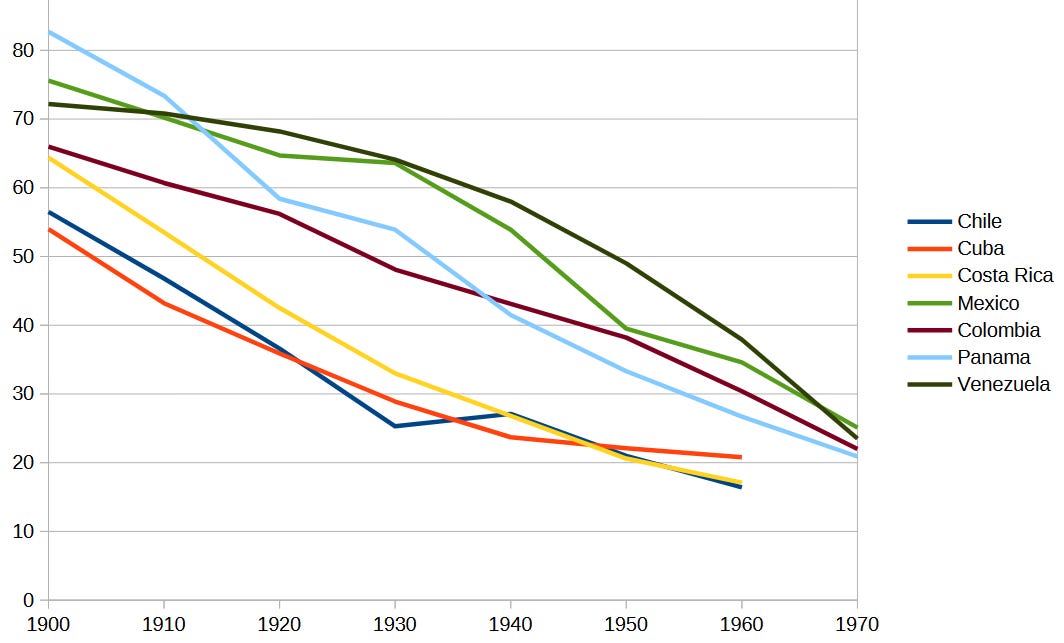
Cuba’s illiteracy rate decreased by less than two percentage points in the 1950s, and barely 1.6% in the 1940s. This is the smallest reduction in literacy among its peers in the 1940s and 1950s.
I initially thought of ending the chart in 1960, right after the Revolution, but then added the 1970 illiteracy rates for all countries with higher illiteracy than Cuba. These 1970 data clearly suggests that reducing illiteracy does not become more difficult below a certain threshold (30%?). Colombia, Mexico, Panama and Venezuela continued to reduce illiteracy rapidly while catching up with Cuba.
Cuba didn’t slow down on illiteracy reduction during the 1940s and 1950s because progress became more difficult. It simply did worse than its peers14.
Conclusion (for now?)
I have to thank Geloso and Pavlik for prompting me to do the research I didn’t do in my previous post, and allowing me to create a more complete picture of Cuba’s socioeconomic performance in the 1950s.
Cuba’s 1950s indicators were certainly not bad, but the country was not near the top of Latin America. More importantly, the data I’ve reviewed shows a picture of stagnation, or at best slow improvement, much slower than the progress seen in its peer countries. Given its earlier standing, Cuba in the 1950s can be described as disappointing.
In the words of Victor Bulmer-Thomas, the author repeatedly cited by Geloso and Pavlik15:
Nevertheless, the Cuban economy was in serious difficulties by the mid-1950s and had gone backwards in many ways. As Table 16.5 shows, Cuban income per head was now below the Latin American average and was ranked only ninth among the twenty republics. Even among the Caribbean countries, the Cuban ranking was in decline… Why, therefore, is there still a myth of a Cuban golden age in the 1950s ruined only by Fidel Castro? It has, of course, been perpetuated by the exile community for obvious reasons, but it has also been defended by serious scholars.
I couldn’t have said it better.
Bulmer-Thomas says in page 333: “following the trade embargo against Cuba, the share of Caribbean merchandise exports going to the United States had declined sharply (see Figure 12.3). Cuba had been the most important economy in the region“. This refers only to the Caribbean region, and refers to the size of the whole Cuban economy, not it’s per capita income.
All numbers for this estimate come from the UN’s 1954 Demographic Yearbook.
Stillbirths in Costa Rica are less than a thousand, in Chile around 8,000 to 7,500, in Ecuador between 2,500 and 3,500. Mexico stillbirths, between 17,000 and 22,000.
I’ve already mentioned the scarcity of Cuban health data for the 1950s in my previous post. Let me just add that the 1962 Demographic Yearbook includes general mortality data for many Latin American countries, reporting the exact number of yearly deaths by cause: Costa Rica, the Dominican Republic, Guatemala, Mexico, Nicaragua, Panama, Puerto Rico, Argentina, Brazil, Chile, Colombia, Ecuador, Uruguay. But not Cuba. The list of countries reporting life expectancy data is the same, except for the addition of El Salvador and Bolivia, and the absence of the DR, Nicaragua, Ecuador and Uruguay. Again, no Cuban data.
1965 was an exception, due to space limitations.
In the 1975 Yearbook Cuba reported a 1970 life expectancy of 68.5 years at birth for males and 71.8 for females. This is slightly higher than the MINSAP number reported by Felipe Sixto, and makes me think that even the 1970 Yearbook figure might have been a bit inflated.
The only European country I can find with a comparable life expectancy is Portugal, which reported 59.8 years in 1957-58.
MOxLAD doesn’t provide an illiteracy figure for 1955 Cuba, so the figure given by Ward and Devereux appears to be an average of the 1950 and 1960 figures.
Table 187, page 691, 1964 UN Statistical Yearbook. There’s no illiteracy data in 1965, 1966, 1967, 1968, 1969, 1970 yearbooks.
Is it strange that data is so scarce for a highly literate country?
Is it a coincidence that Brazil had one of the lowest rates of literacy in Latin America at the time?
I have to admit, I did not expect Yugoslavia’s illiteracy to be that high.
Also, Ward and Devereux (2012), who do not say Cuban literacy rivaled Europe but did cite the 21% figure, mentioned the following countries when comparing Cuban income to European income: “Our European data cover Belgium, Demark, France, Germany, Italy, Netherlands, Norway, and the United Kingdom in 1955“.
It should also be noted that Cuba did worse than Costa Rica and Panama in absolute literacy levels, not just reduction rate of illiteracy, when accounting for differences in urban to rural population ratios. According to Wikipedia “Before the campaign, the rate of illiteracy among city dwellers was 11% compared to 41.7% in the countryside“; that’s a very large gap between urban and rural illiteracy in Cuba. As I mentioned in my previous Cuba post, the country was significantly more urbanized (63%) than other Latin American countries, including Costa Rica (<37%) and Panama (42%). It’s highly likely that Costa Rica and Panama both had lower urban illiteracy and lower rural illiteracy than Cuba in the 1950s.
Victor Bulmer-Thomas, The Economic History of the Caribbean Since the Napoleonic Wars, 2012, page 458.
Goddammit, Javier, now I'm going to have to write a riposte to your riposte. Aaargh!
I intend to smoke a lot of cigars while doing so.