
New numbers on UK manufacturing employment
The third part of my questioning of the British decline narrative

Today I’m publishing a short piece. Just a follow-up on my previous pieces on the supposed British decline.
A few weeks ago the UK’s Office for National Statistics (ONS) published its provisional Annual employee and employment estimates for the year 2022. Since I mentioned the ONS’ estimates for previous years when arguing that British manufacturing is not collapsing in my previous post on the British decline narrative I decided to take a look at the new figures to check if my argument still holds.
This is the table I included in that post, with UK manufacturing employment (in thousands).
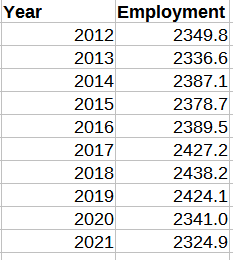
The number for employment in 2021 came from a provisional report, so I’ll also replace that provisional number (2324.9) with the revised one.
Here is the graph for manufacturing employment in Great Britain from 2012 to 2022.
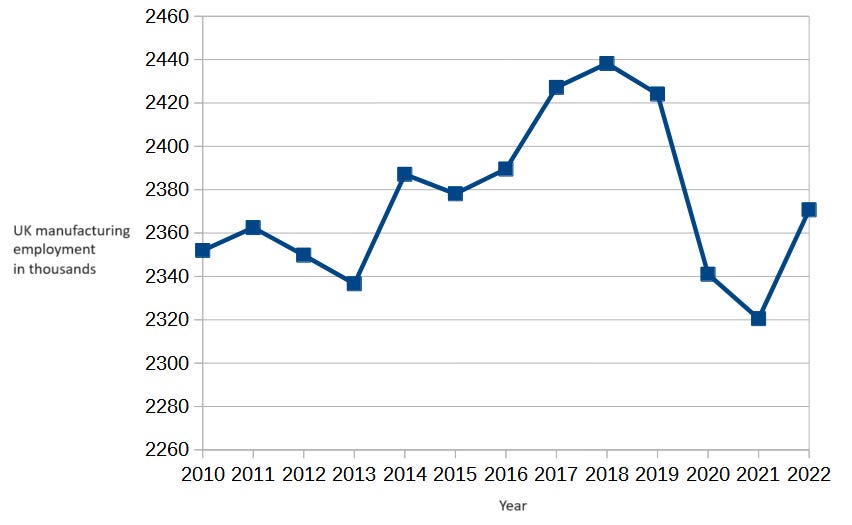
That doesn’t look like a long-decline-induced decrease in manufacturing employment, it looks like a drop caused by Covid-19 followed by a corresponding partial recovery.
The same graph for France looks like this.
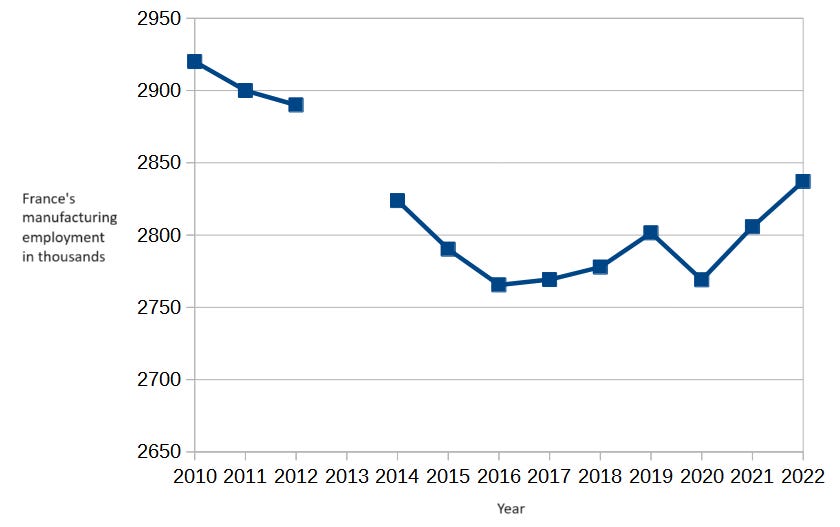
Even tough manufacturing employment is higher in France (populations of both countries are similar) the trend for employment in France is a slow decrease while the trend for employment in the UK is neither an increase nor a decrease.
So, still not much evidence for British decline.
A caveat. These numbers are not for the UK as a whole but for Great Britain (excluding Northern Ireland). But the curve for the UK is the same as the curve for Great Britain.