
A comparison of gender equality between Latin America and Orthodox Europe (Part 1)
My attempt at a sensible answer to Alice Evans

A few weeks ago I saw this Note by Alice Evans who writes The Great Gender Divergence (highly recommended).
Since I’ve been meaning to write about Latin America for some time, that being one of the reasons why I started this Substack, and I felt that Alice’s third point in that Note might misrepresent the level of gender equality (or inequality) in Latin America and what Latin American women understand as gender equality, I decided that was a good excuse for writing a post about gender equality in Latin America, in particular gender equality in Latin America compared to Orthodox Europe.
Gender equality could mean different things to people from different cultures. In particular, are we talking about equal rights and responsibilities? Equal economic results? Equal educational results? Equal participation in political bodies? I mention these variables because they are the ones most often used by international bodies and institutions, like the United Nations Development Programme, to measure gender equality in different countries.
So in order to better understand gender equality, or inequality, in Latin America I decided to take a closer look at some of those variables for Latin American countries, and take a look at those same variables in Orthodox European countries.
I’ll start with female labor force participation (FLFP).
Labor force participation
Women’s labor force participation in Latin America is lower than in Orthodox Eastern Europe. In fact it’s consistently lower than FLFP for every country in that region except Romania, North Macedonia and Moldova (which doesn’t appear in the graph):

Notice how from approximately 2005 to the present the level of participation has leveled off at around 55%. That is also far bellow the level of participation in developed areas of the world: EU, North America, East Asia and the Pacific.
Why did labor force participation stop growing? I think the reason might become obvious if I show you how labor force participation varies within Latin America.
Here’s a table with GDP per capita PPP (Purchasing Power Parity) and female labor force participation for 13 Latin American countries.

I excluded Venezuela from the group of Latin American countries because its labor market functions in a completely different way than the other countries after losing more than 20% of its population in the last few years (though if you look at its women participation, it’s a pretty interesting phenomenon if you want me to elaborate on it). And I took the average participation for the years 2017, 2018 and 2019 in order to avoid the effect of Covid-19.
The correlation between GDP per capita PPP and women’s labor force participation in those 13 countries is -0.36, as can be gleaned from this scatter plot.
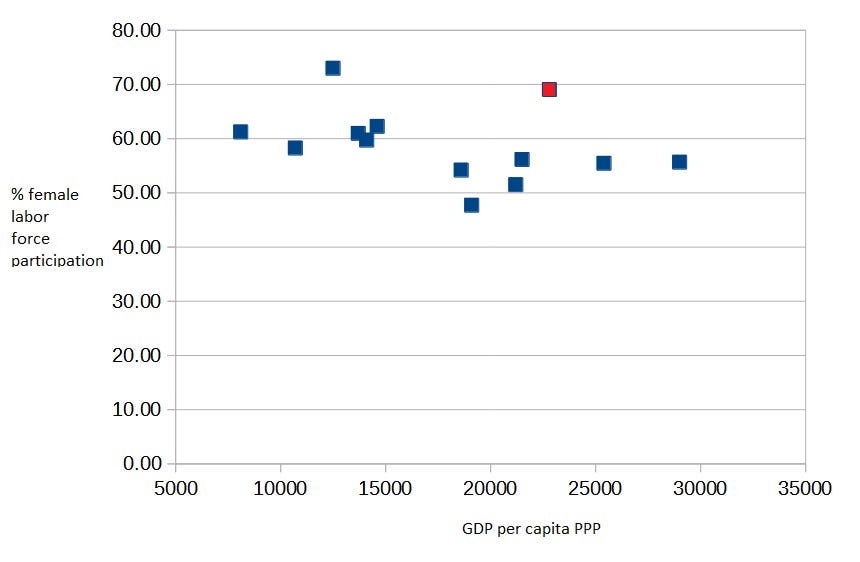
In fact if I take out Uruguay (the red dot in that plot), the most divergent South American country in terms of culture, the correlation value becomes -0.55.
For Latin American countries it appears to be the case that the higher average income is, the less women feel compelled to work.
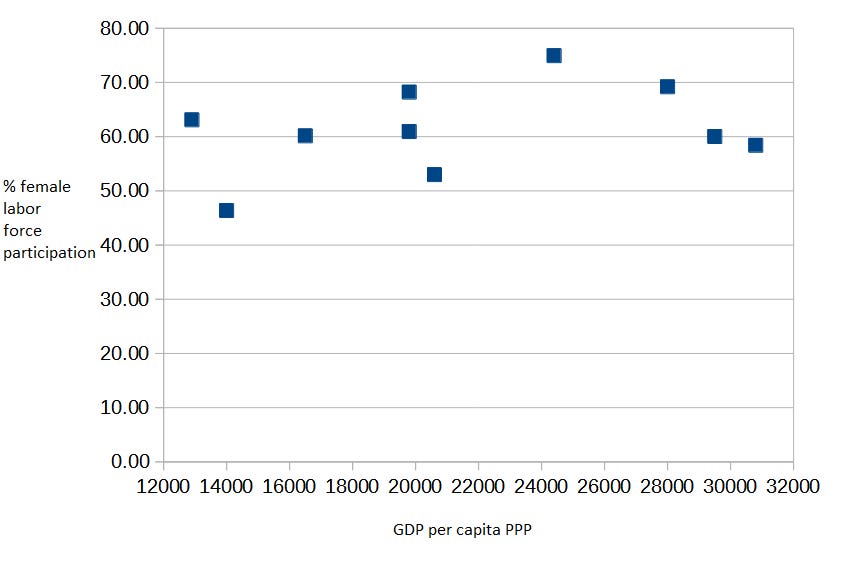
What about Orthodox European countries? Do they experience the same phenomenon of women working less as income increases?
The answer to that question is no.

As can be seen in the previous table, European Orthodox countries not only have higher FLFP than Latin American countries on average, but also the correlation between GDP per capita PPP and FLFP for them is 0.33, meaning that apparently the higher the income the more women feel compelled to work.
This is very important for two reasons.
First, a very common argument when discussing female labor force participation is that women’s decision to work outside the home is influenced to a large degree by the trade-off between domestic unpaid labor (childcare, cooking, cleaning, etc…) and the wages that women can make by working outside the home. If the value of domestic unpaid labor remains the same, then an increase in wages paid in an economy (say the economy of Peru) should motivate women to participate in that economy by working outside the home.
This argument which seems well supported by the FLFP data for most countries doesn’t seem to hold for most Latin American countries.
The second issue is if we take the optimistic view that Orthodox countries and Latin American countries are developing countries and assume that their development will continue for the next decades, and consequently their income and wages will increase, then is seems reasonable to predict that FLFP in Orthodox countries will increase in the next decades while FLFP in Latin American countries will stagnate - or even decrease - in the next decades. This would make Orthodox countries even more gender equal in the next few decades, assuming FLFP is a good measure of gender equality, compared to Latin American countries.
Political participation
What about political participation by women in Latin America?
The United Nations Development Programme (UNDP) has created an index for measuring gender inequality, the Gender Inequality Index (GII), as part of its annual Human Development Report.
One of the indicators used to calculate the GII is the percentage of parliamentary seats held by women as a proxy for political participation of women. So let’s take a look at that indicator for Latin American and Christian Orthodox countries.

The average is 28.12% for Orthodox countries compared to 30.43% for South American countries or 33.52% for all Latin American countries. So women’s political participation seems to be definitely higher in Latin America than in Orthodox Europe.
But despite that fact the average value of GII is 0.17 for Orthodox countries compared with 0.36 for South American countries or 0.37 for all Latin American countries. A lower value of GII means more gender equality and so Orthodox countries are more gender equal compared to Latin American countries according to UNDP.
Let’s try to double check women’s political participation by looking at another indicator: women mayors. Being a representative in parliament may be the result of being put on a list by your party, and it might entail the expectation that the representative is just there to occupy a seat and always vote the way the party says, while at the same time allowing said party to pay lip service to gender equality. But being a mayor entails having to deal with citizens problems, big and small, on a daily basis, and solve them by using a limited number of resources. At least in a working democracy.
I decided to look for the percentage of women mayors for all Latin American countries and all European Orthodox countries, and for those countries where I couldn’t find that percentage estimate it myself by taking advantage of the fact that most of the time you can find the name of the mayor for a local government in Wikipedia and for almost any country female names and male names are clearly distinct. I also looked at the percentage of women mayors for 16 European countries neighboring on European Orthodox countries for comparison.
What follows is a long list of those countries with some details about how I came up with the estimates in order to make possible to replicate these results. If you are just interested in the results you can skip the list and go straight to Tables and maps for political participation.
Bolivia
For Bolivia’s municipalities of more than 20,000 population the percentage of women mayors is 8.7% (just 6 women). That’s just for 69 out of 84 municipalities where I could find the name of the mayor in Wikipedia.
Nicaragua
For Nicaragua I could only found the name of the mayor for 45 municipalities, and 51% of those municipalities have a woman mayor. 51% seems to be good to be true. More on that later.
Mexico
For Mexico I found the name of the mayor for 1,688 of its 2,475 municipalities, and 25.4% of those municipalities have a woman mayor. It might have something to do with this and this.
Costa Rica
For Costa Rica I looked at its 82 cantons and 8 intendencies, which appear to be the lowest level of government, and found 14.4% were headed by a woman.
Romania
For Romania I checked its 2,860 local governments (comune). Didn’t include its 101 municipalities of level 0, I and II which usually correspond to cities. Women mayors are 5.6% of the total.
Greece
For Greece I checked all the municipalities for which I could find the name of the mayor in English Wikipedia, 147 municipalities out of 332, and found only 9 women mayors. That’s 6.1%.
North Macedonia
For North Macedonia I first tried looking at all municipalities with a population over 30,000 but could not found a single woman mayor. Then I tried lowering the population threshold and lowering it again until I finally found Zaklina Jovanovska who is the woman mayor of the lovely village of Staro Nagoričane (population 3,501).
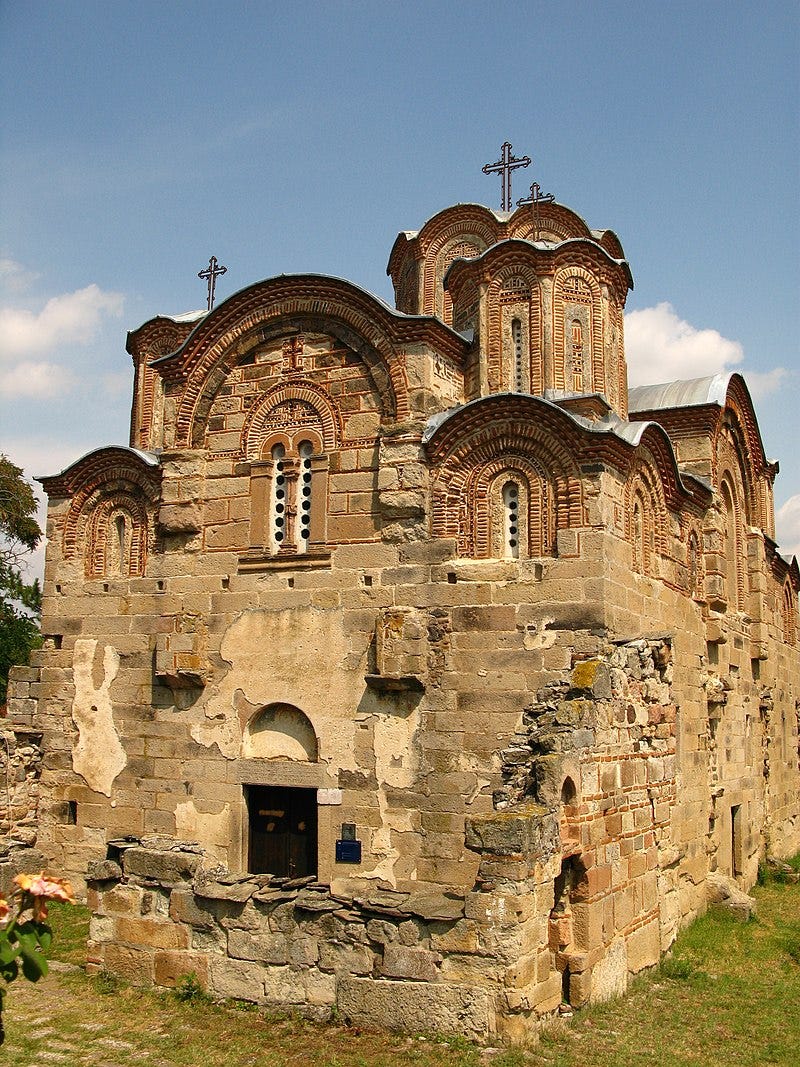
Turns out there are only two women mayors for all the 84 municipalities and one super-municipality (for the metropolitan area of Skopje, the capital) of North Macedonia. The reason I hadn’t found Danela Arsovska at the beginning of my search is because she is the super-mayor of that special municipality of Skopje. And 2 out of 85 is 2.4% in case you were wondering.
Russia
Out of the 200 largest Russian cities by population only found 7.9% of those indicating a mayor or head of local government in English Wikipedia are women, but apparently women mayors are much more common in the largest cities (15% for the 80 largest cities).
Albania
For Albania, 8 women were elected mayor in the last election, all of them from the party that has dominated politics in Albania for the last 10 years. That’s 8 out of 61 municipalities.
Hungary
For Hungary, cities over 5,000 population (242 cities), the percentage is 12.2%.
El Salvador
For El Salvador there are 14 women mayors out of 110. Percentage is 12.7%.
Argentina
For Argentina, out of 912 municipalities for which I could find an elected head of government (intendente) 11.7% are women.
Kosovo
For Kosovo, out of a total of 38 municipalities either one or zero are headed by women. I couldn’t figure out whether Vladica Aritonović, the mayor of Ranilug/Ranillug, is male or female and so that means the percentage of women mayors for Kosovo is either 0% or 2.6%. I also calculated the percentage of women parliamentarians from the Kosovan parliament site since I couldn’t find it anywhere in the GII report of UNDP. It’s 33.33%.
Belarus
I’m not so sure about the validity of elected Belarusian women mayors as a measure of gender equality in political participation but for what it’s worth 5.4% of 111 Belarusian municipalities have a women mayor.
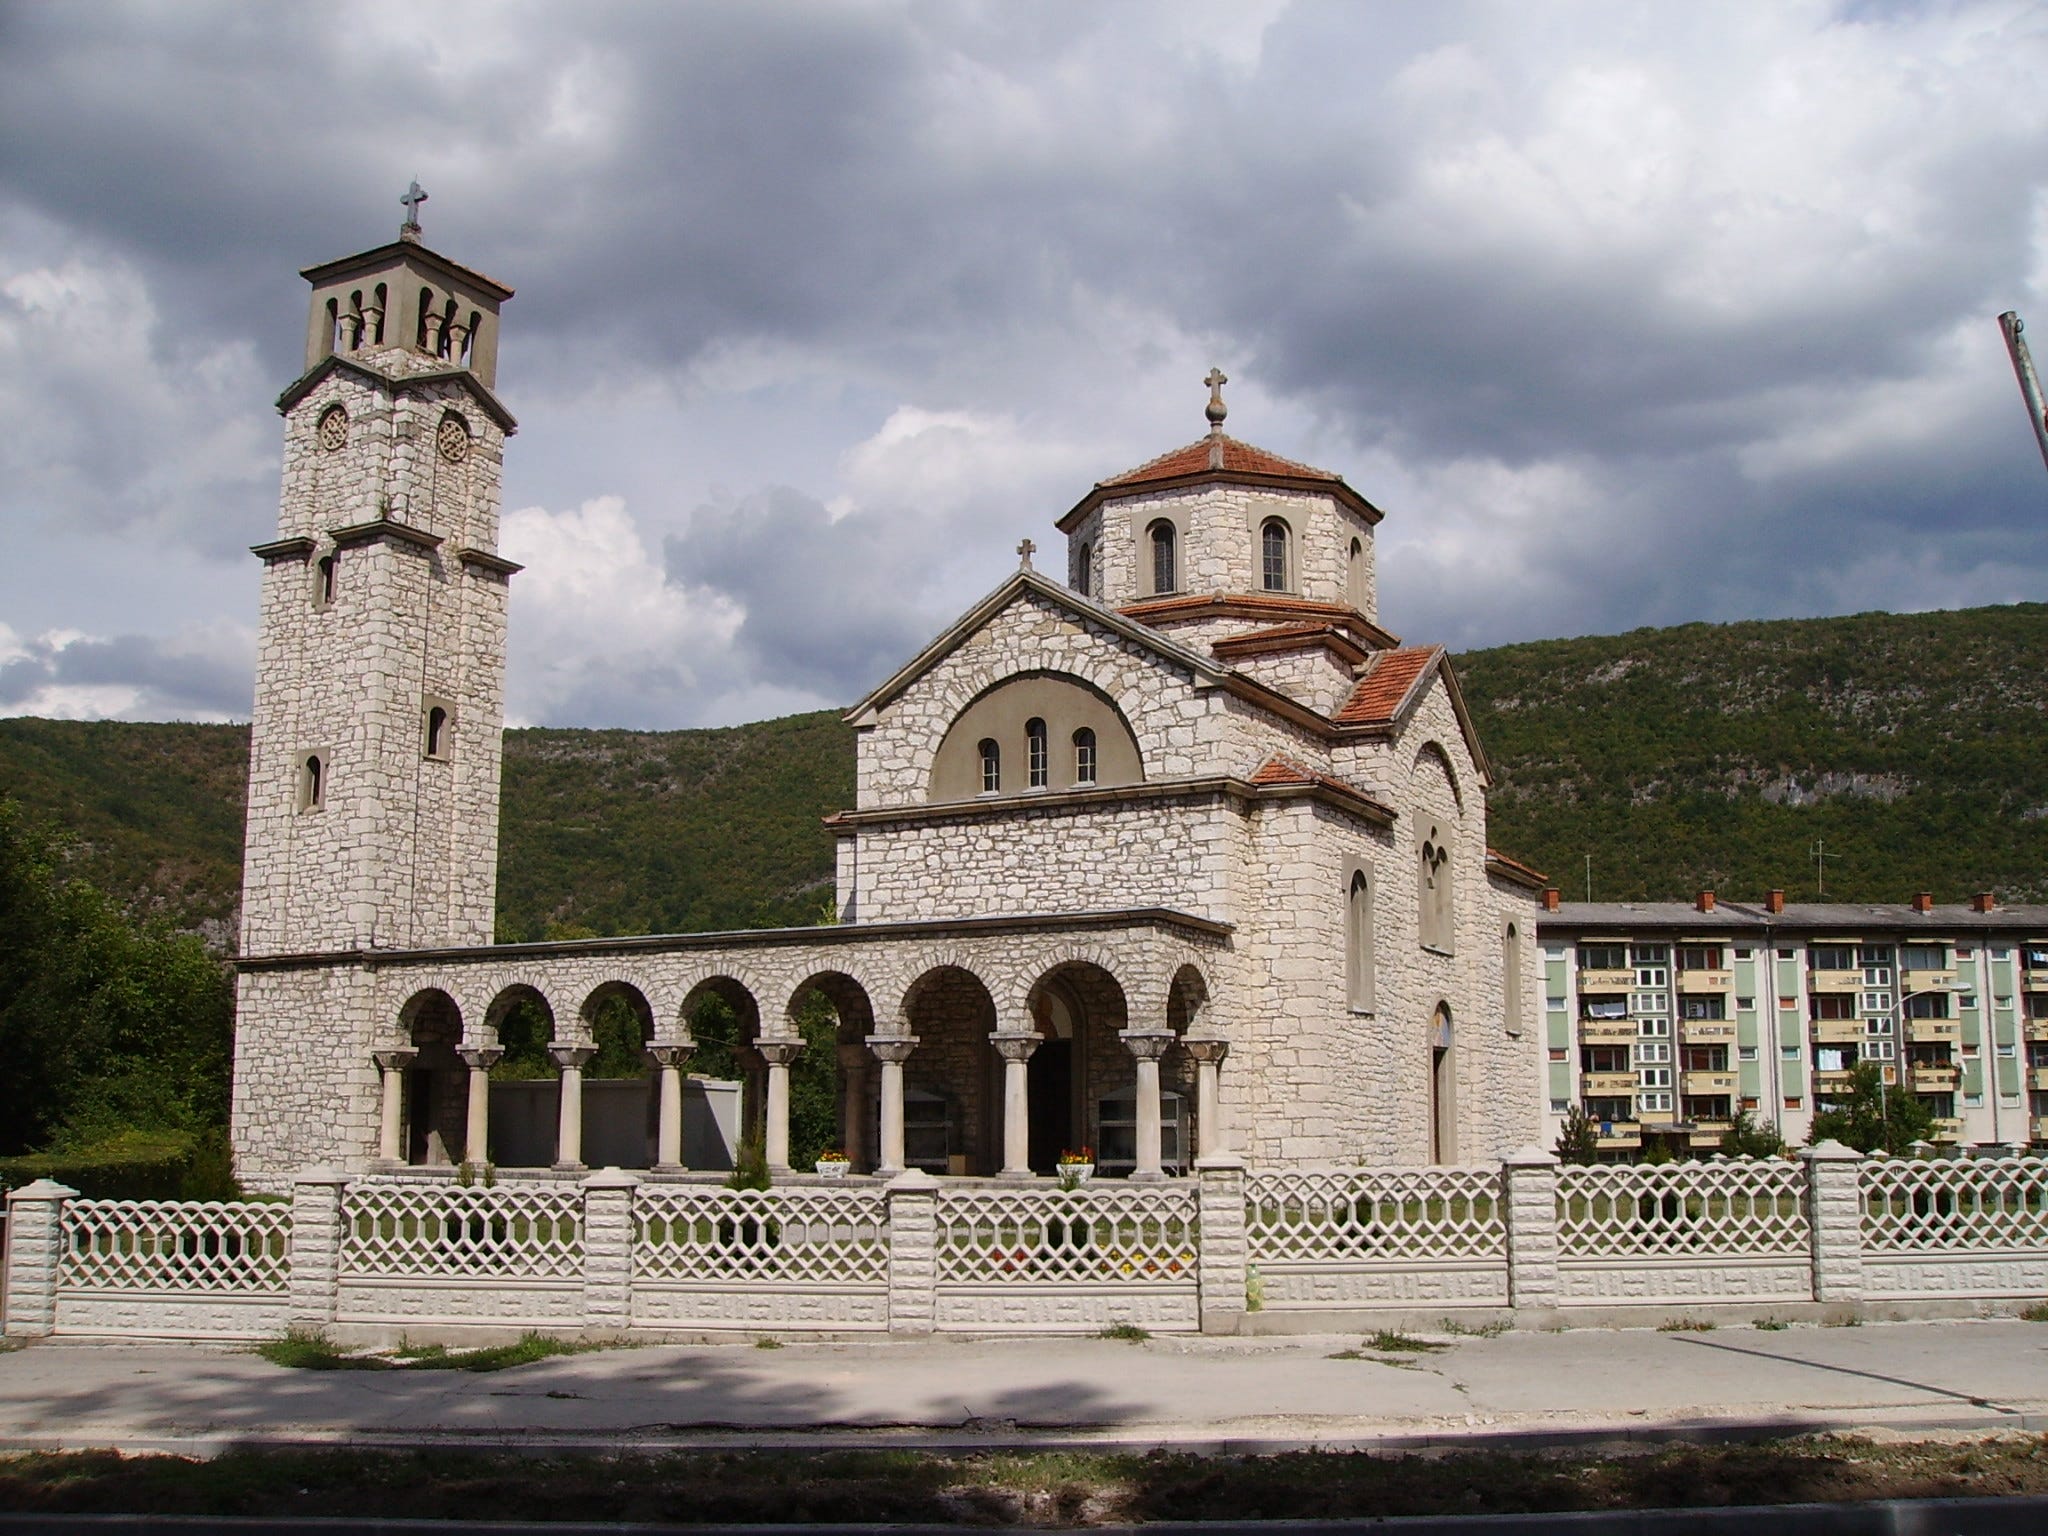
Bosnia and Herzegovina
79 of the 144 municipalities of Bosnia belong to the Federation of Bosnia and Herzegovina (Bosniak and Croat), 64 belong to Republika Srpska (Serbian) and 1 municipality corresponds to the district of Brčko. The percentage of women mayors for all of Bosnia is 3.5%, with the Federation of Bosnia and Herzegovina having a 2.5% and Republika Srpska having a 4.7%. Curiously, two of the only five municipalities headed by a woman are right next to each other but in different sides of the border. The municipality of Drvar is part the Federation of Bosnia and Herzegovina while the municipality of Istočni Drvar is part Republika Srpska, and Istočni Drvar was part of the old municipality of Drvar previous to the Bosnian War.
Croatia
For Croatia I checked all the municipalities for which I could find the name of the mayor in English Wikipedia, 326 municipalities in total, and found 24 women mayors which is to say a 7.4%.
Ukraine
For all the cities of Ukraine for which I could find the name of the mayor, 27 out of 380. The percentage is 7.1%.
Slovenia
For the 204 municipalities of Slovenia that state the mayor’s name in English Wikipedia 11.8% of them mention a woman mayor. I later found a paper which gives a 13.7% women mayors for Slovenia.
Slovakia
I found a paper on Women mayors in the Slovak Republic by Jana Lukáčová and Lenka Maličká which found that 26.01% of municipalities in Slovakia are headed by women mayors. I took the opportunity to try to validate my methodology by calculating the percentage in the same way I did for other countries and comparing it with the percentage from the paper. My percentage is 26.4%.
Lithuania
For Lithuania I just used the figure given by the paper Women’s political representation at local self-government in Lithuania: the case of mayors by Ingrida Frankienė, Virginija Šidlauskienė, Vita Juknevičienė, Sigitas Balčiūnas, Oksana Mejerė, and that figure is 8.3%.
Bulgaria
Bulgaria has the second highest percentage of women mayors of all the Balkan countries and all the Orthodox countries that I included, with 16.3% of women mayors.
Serbia
In the case of Serbia I didn’t consider those municipalities that are part of Kosovo - only because I’d already estimated the figure for Kosovo, not a political statement - and for the remaining 145 municipalities I got a figure of 13.7% women mayors.
Brazil, Chile, Colombia, DR, Ecuador, Guatemala, Honduras, Panama, Paraguay, Peru, Uruguay
For all other countries in Latin America I’m using the figures from CEPAL, which are very close to the ones I calculated for Argentina, El Salvador, Costa Rica, Mexico, Nicaragua and Bolivia although a bit lower, probably due to being from 2021. You can find all the percentages for these countries in the table included in the section Tables and maps for political participation.
Poland
Found an article by Jacek Bruchal from the City Mayors Foundation stating that 10.3% of women mayors in Poland are women.
Montenegro
Out of the 25 municipalities of Montenegro, I found the name of the current mayor for 20 of them and none of those 20 have a woman mayor.
Latvia
Found a thesis paper by Diāna Heislere and Lauris Zalva stating that the percentage of women mayors in Latvia is 23%.
Czech Republic
The figure for the Czech Republic is 24% apparently.
Germany
A study by Frauen Macht Politik found that only 9% of German mayors are women.
Austria
Several sources report a figure of 9% women mayors in Austria.
Switzerland
The figure for Switzerland is 16% apparently.
Estonia
I found 63 mayors for the 79 municipalities of Estonia, and 19.0% of them are women.
Moldova
Out of 66 municipalities of Moldova I found the names of 60 mayors, 18.3% of whom are women.
Italy
The figure for Italy is 15% apparently.
Tables and maps for political participation
The following is a color coded map of all the European countries included in the previous list with red representing 0% women mayors (Montenegro) and blue representing 26% women mayors (Slovakia).
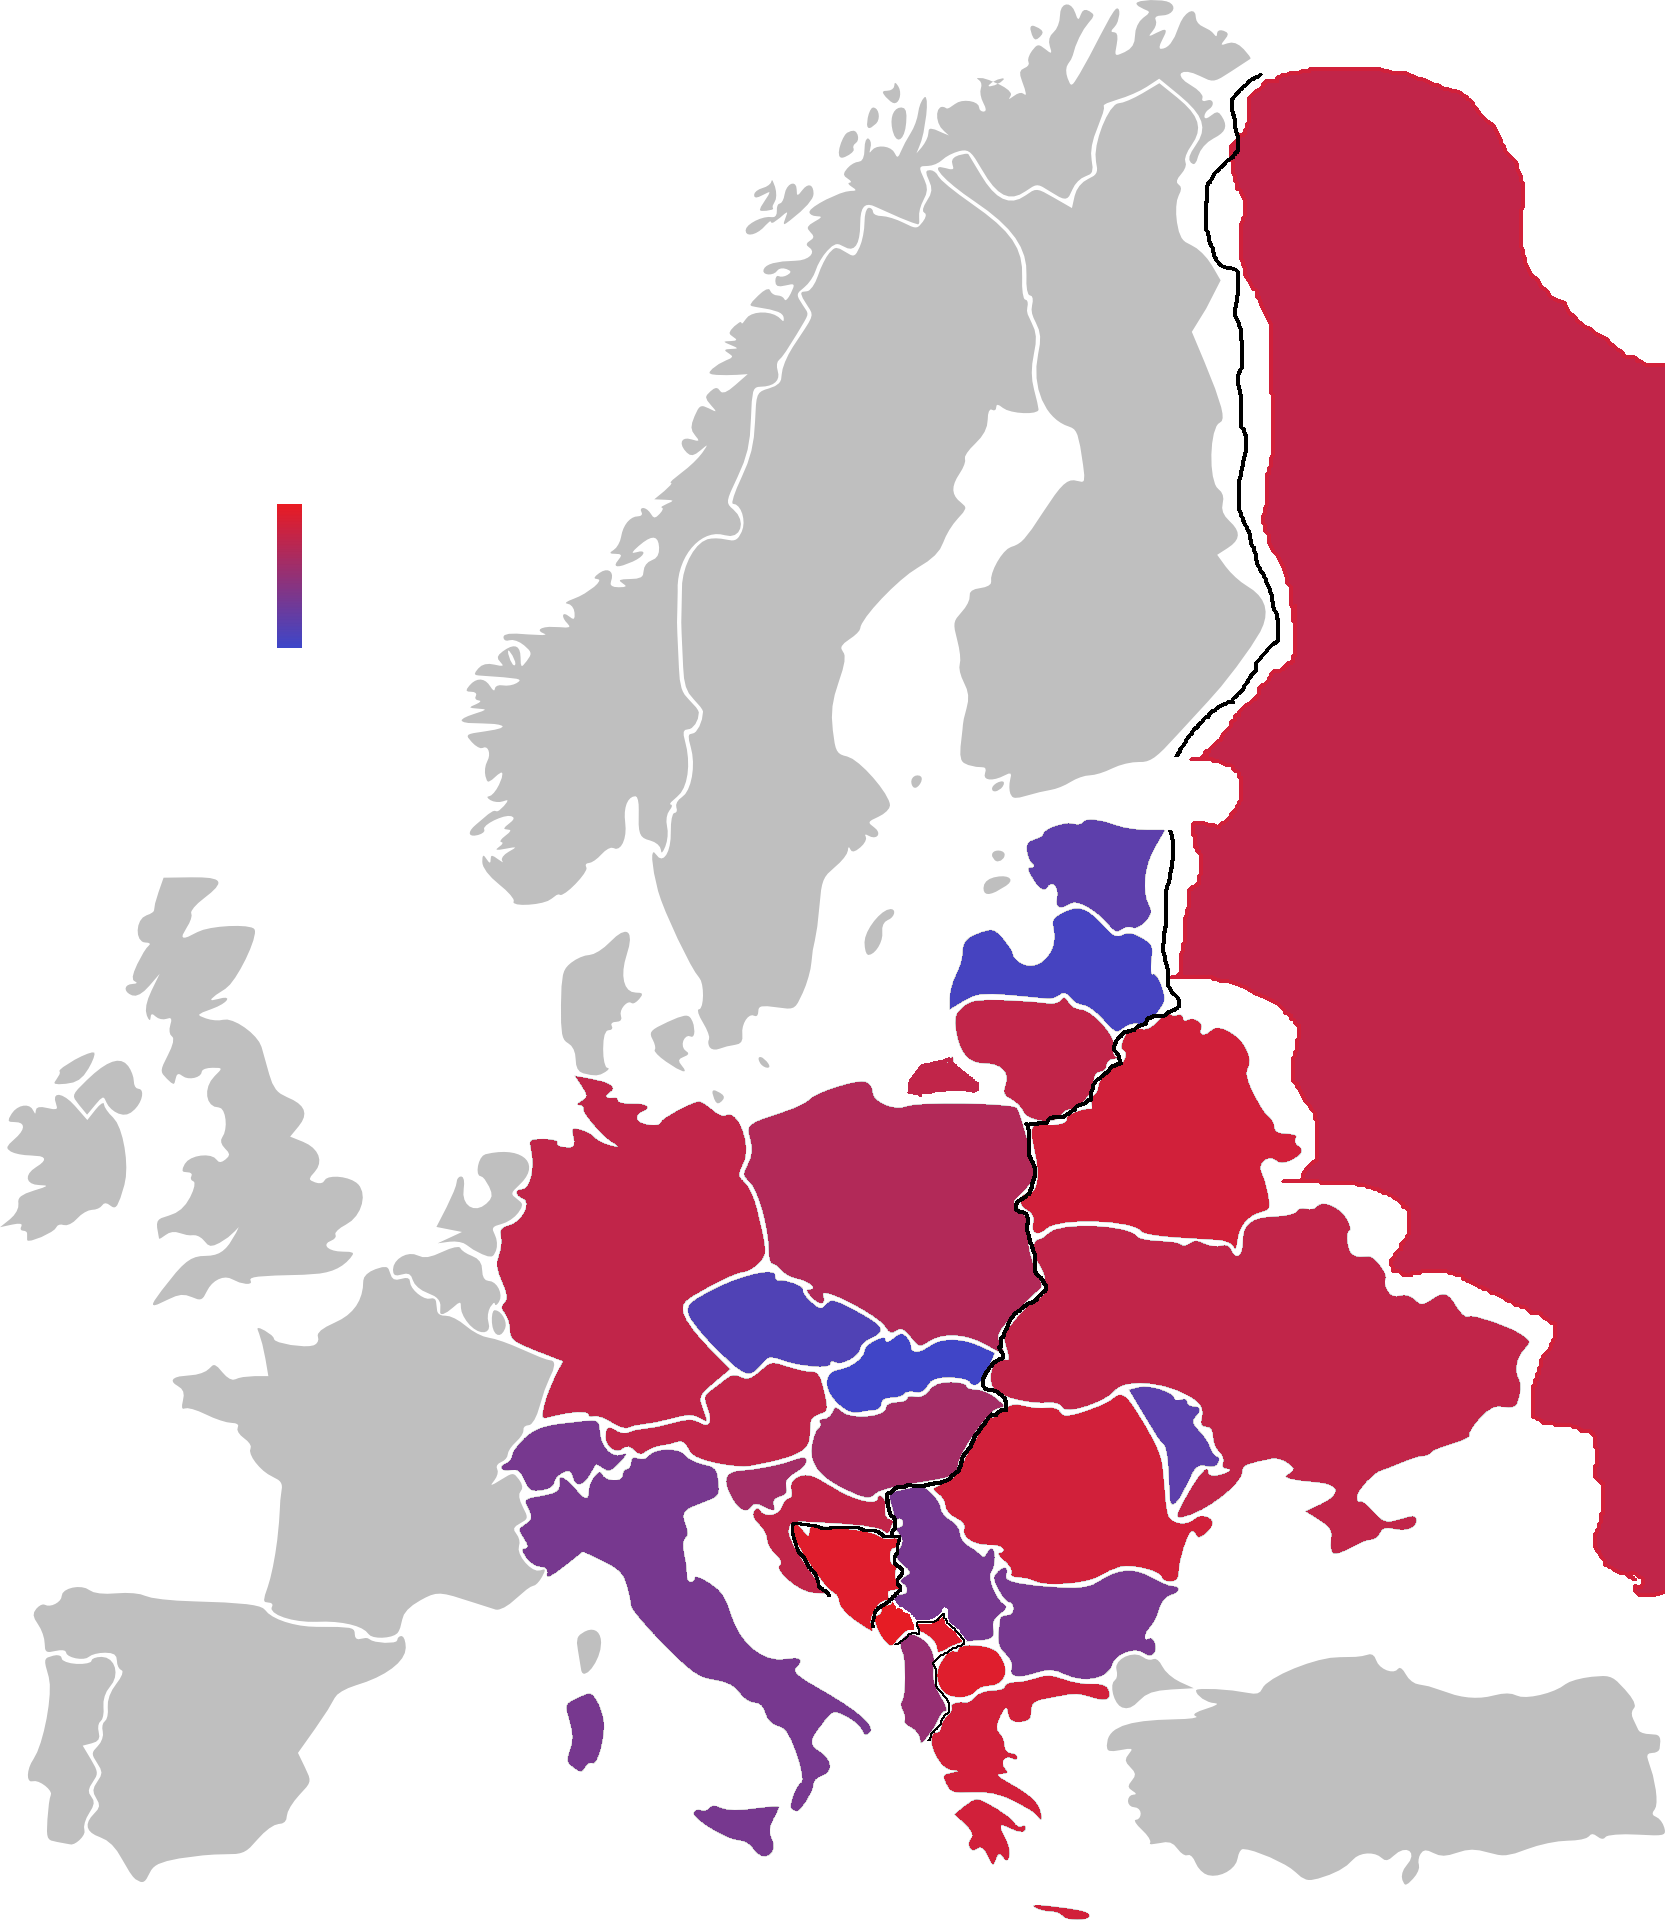
You’ll notice there’s a black line separating Orthodox countries from non-Orthodox countries. Or actually more than one line because some countries in the Balkans have traditionally practiced Orthodox Christianity, Catholicism or Islam depending on the region.
In particular Bosnia is divided into a Croat (Catholic) and Bosniak (Muslim) entity and a Serbian (Orthodox) entity. Both of them have a low percentage of women mayors (3.5%) but the Serbian (Orthodox) entity has a slightly higher percentage (4.7%) than the Croat (Catholic) and Bosniak (Muslim) entity which has a 2.5%.
Similarly, Kosovo (95% Muslim) and North Macedonia (30% Muslim approximately) have the third and second lowest percentages of women mayors of all the European countries I analyzed.
Just by looking at that map it’s not very clear that countries which now practice or traditionally practiced Orthodox Christianity, those to the right of the black line, have lower percentages of women mayors, or that those to the left of the black line (from a Catholic or Protestant tradition) have higher percentages of women mayors.
That’s not to say that there is no correlation between being a traditionally Orthodox country and a lower percentage. In fact the average for all Orthodox countries is 8.4% women mayors compared to an average of 13.2% women mayors for all other European countries in the map. And the correlation between being Orthodox and percentage of women mayors is 0.34, a small but not insignificant correlation.
Here are the percentages of women parliamentarians and of women mayors for the three groups of countries that I’ve mentioned so far, showing how for all groups the percentage of women mayors is substantially lower than the percentage of women parliamentarians.

In fact only three countries, Slovakia, the Czech Republic and Nicaragua have a higher percentage of women mayors than of women parliamentarians. In the case of Slovakia and the Czech Republic I’m inclined to think it’s the result of more gender equality and less concern by Czech and Slovak political parties for the appearance of gender equality. In the case of Nicaragua I’m inclined to think it’s the result of the desire of the Nicaraguan government to appear as a more gender equal country by manipulating electoral results.
Here is the complete table with all countries in the three groups.
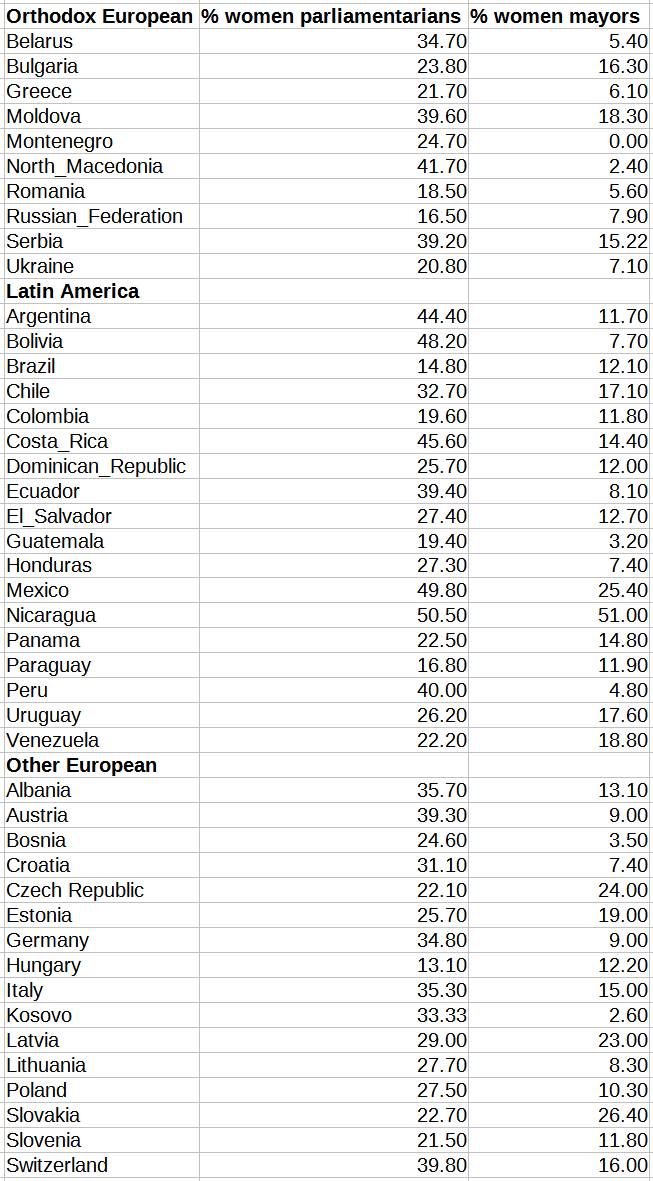
As can be seen in that table Hungary doesn’t have a higher percentage of women mayors than of women parliamentarians, but is very close to it with 12.2% for mayors vs 13.1% for parliamentarians. Maybe Hungary is not a very gender equal country - though its rank is 55 out of 191 in the GII - while being a rather honest country nonetheless.
I should probably mention at this point that Mexico has a law that encourages the election of women mayors and that probably has something to do with it’s relatively high percentage, twenty-five percent, of women mayors.
Besides noticing those unusual cases (Mexico, Nicaragua) and the fact that yes, Latin America does have more female political participation than Orthodox Europe when measured by percentage of women mayors, my analysis hadn’t revealed anything else worth mentioning. But then I did notice a couple of things which I plan to comment on in the second part of this series of posts. Yes, it’s a series.
But then I did notice a couple of interesting things that I’ve commented on in Part 2 and Part 3 of this post.
Stay tuned, and if you enjoyed this post please subscribe.