

I’ve written before about the declining cultural influence of America as measured by Hollywood’s international box office numbers, but I haven’t broken down this trend by country. Total international box office is the sum of many countries’ figures, and the total might be hiding a composition effect: Hollywood’s box office may be declining in some countries but remaining stable - or even increasing - in others.
Before doing that, let’s take a look at an updated chart of Hollywood’s international box office ratio. A quick refresher: the ratio is calculated as the total Hollywood international box office, excluding China, divided by Hollywood’s domestic box office (United States and Canada). The reason for excluding China is to isolate the decline of American cultural influence in China (which I assume everyone agrees on) from the question of whether Hollywood’s influence is also waning in the rest of the world.
Here’s the chart:
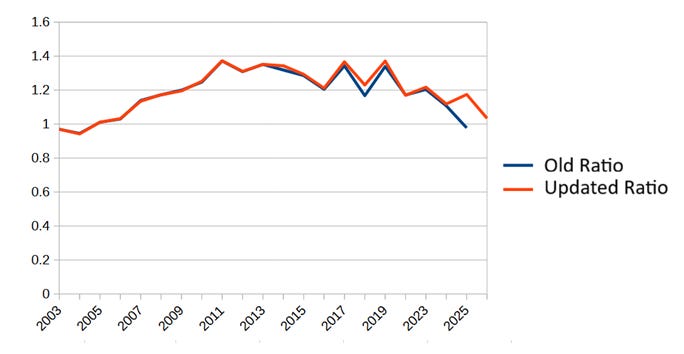
The blue line shows the version I presented in August 2025, while the red line is the updated one. Clearly, there’s a problem: they differ by a non-insignificant amount for the year 20251.
What happened? Well, Avatar happened. 69%2 of Avatar: Fire and Ash’s $1,48 billion box office came from international markets. Together with Zootopia 23, which came out in November, they raised the 2025 ratio above the 2024 level. Excluding Zootopia 2 and Avatar, the difference between my August 2025 estimated ratio and the final 2025 ratio would have been very small (0.958 vs 0.978).
Although my chart doesn’t look so pretty now (thanks James Cameron), I still believe the long-term trend is for international box office to continue dropping relative to domestic box office.
With that out of the way, let’s examine the declining trend in a few Latin American countries. Since my source of data, Box Office Mojo, doesn’t provide figures for every country and every movie, I had to limit this analysis to only five countries: Argentina, Brazil, Chile4, Colombia and Mexico.
First, each country’s yearly share of total international box office. I took 2004 as the starting year for this index.
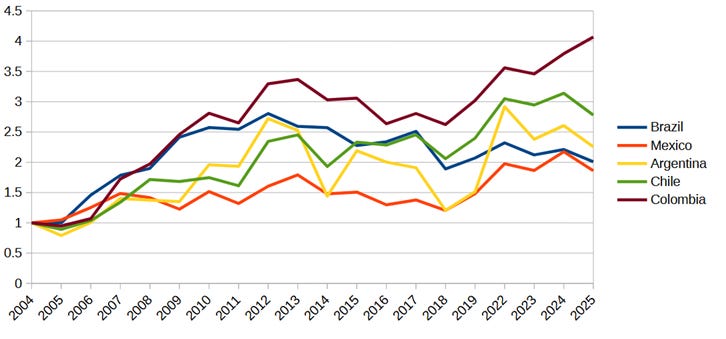
The reason for dividing each country’s box office by the international total is to control for broad changes affecting all international markets. We already know that total box office after Covid is substantially lower than before the pandemic (around 29%-33%). What we want to know now is whether these Latin American countries followed the general trend; and if not, in which direction they diverged.
Going by the chart above, all five countries end up with a higher share than they started with. Colombia’s share grew the most, while Brazil and Argentina showed the greatest variation. In the case of Brazil, it looks like there’s a downward trend from early 2010s onwards.
A few caveats though:
Argentina’s figures are distorted by the economic crises it suffered in 2014 and 2018.
The economies of Colombia and Chile grew the most during this period. Their rising trends might simply reflect their growing purchasing power, and not a growing appetite for Hollywood’s offerings.
The apparent trends may be influenced by the choice of starting year5.
To address the second point, let’s look at each country’s box office divided by its national GDP. This controls for the effect of economic growth on box office figures.
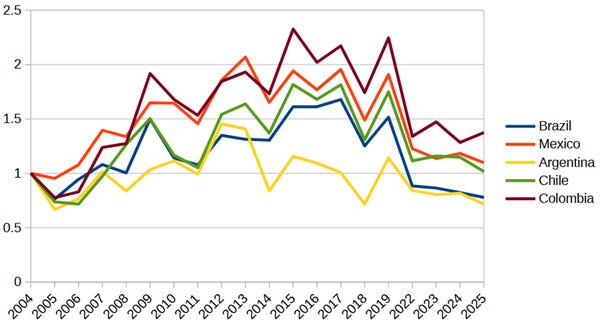
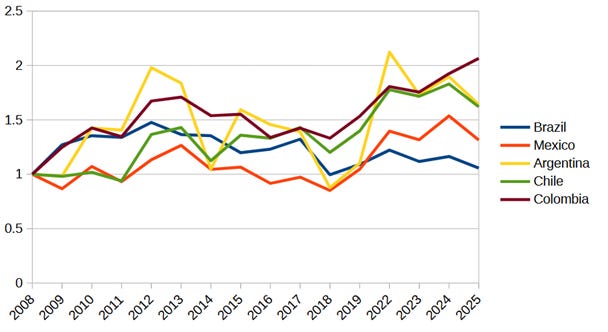
This time, the post-Covid decline is clearly visible. Since the choice of starting year may be even more influential for this index, let’s also try with a later year: 2008.
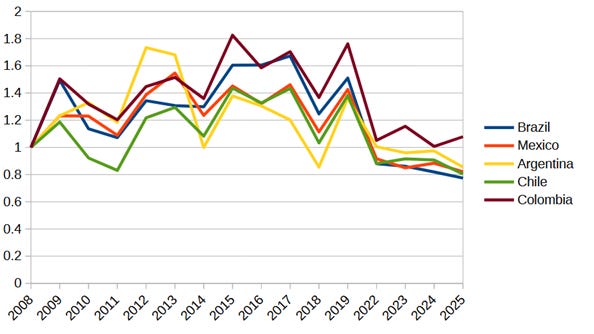
The most visible trends in these two charts are: Brazil again shows the sharpest drop, this time from the mid-2010s onwards, while Colombia had the smallest decline. About Argentina’s apparent decline, I still think it can be attributed to the economic troubles the country suffered during this period.
To summarize:
Brazil definitely experienced the largest relative decline as a market for Hollywood.
Colombia’s box office increased, even after controlling for a larger economy. Relative to the other countries, it’s a Hollywood success story.
Chile looks like the second-best market for Hollywood, although Mexico is almost as strong when adjusted for economic growth.
Is that all we can say about individual countries?
In Latin America, yes. But we can run the same analysis for Europe and see what it shows us.
Europe
At first I decided to limit the analysis of Europe to the largest countries: France, Germany, Italy, Spain, and the United Kingdom. Since all of them experienced similar economic growth during the period, I’m only going to show their share of total international box office (no controlling for GDP).
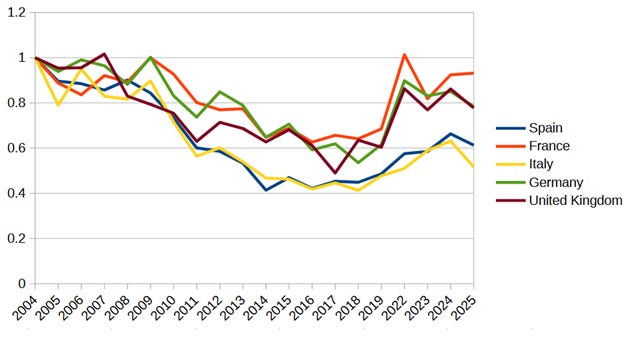
That drop after 2008 looks like it could be related to the 2008 financial crisis. To ensure it doesn’t affect the analysis, let’s plot the same index starting in 2010, after the crisis.
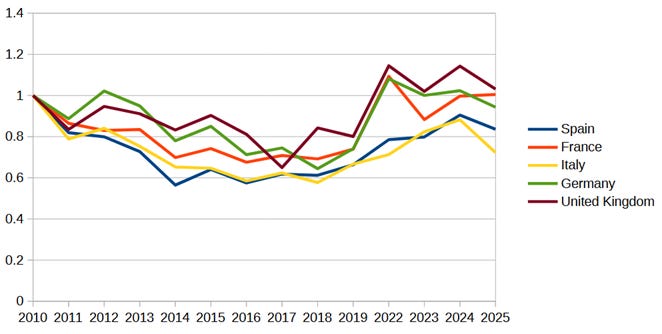
Based on those two charts, Europe can be divided into two groups. The first - comprised of France, Germany and the UK - trends higher than the second one, composed of Italy and Spain.
This suggested to me that there’s a pattern of southern European countries experiencing relative decline in box office share compared to the rest of Europe, but I can’t be sure unless I take a look at Greece and Portugal. Given that Greece suffered one of the deepest economic crises of any developed country during this period, it makes sense to compare it with other European countries while controlling for changes in GDP.
So here are the charts for southern European countries, plus France for comparison, starting in 2004 and 2010, and controlling for GDP.
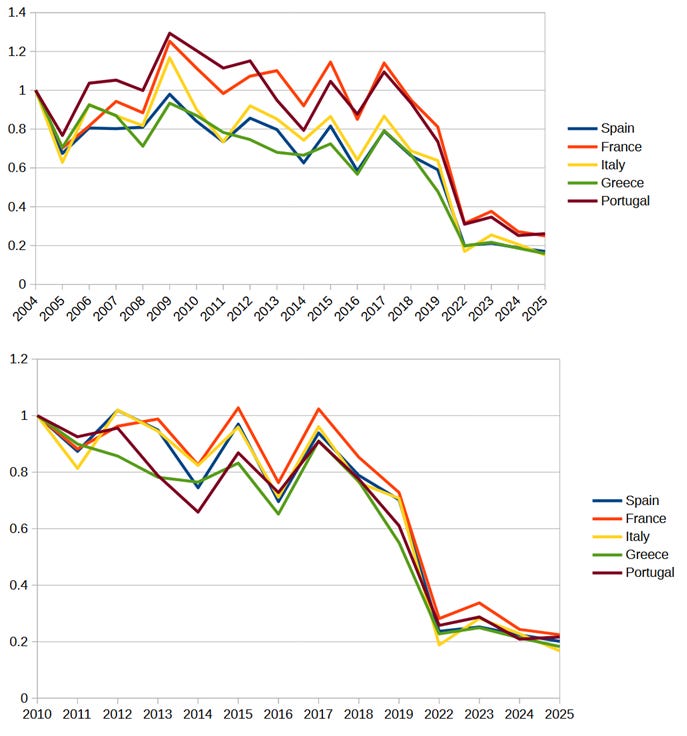
The chart starting in 2004 places Greece with the southern European group, but doesn’t place Portugal in that group. The one starting in 2010 is simply inconclusive (although France remains higher than all the others). This result was underwhelming enough that I decided to explore other European countries.
Here are two share of international box office charts, starting in 2004 and 2010, but this time including most northern European countries.
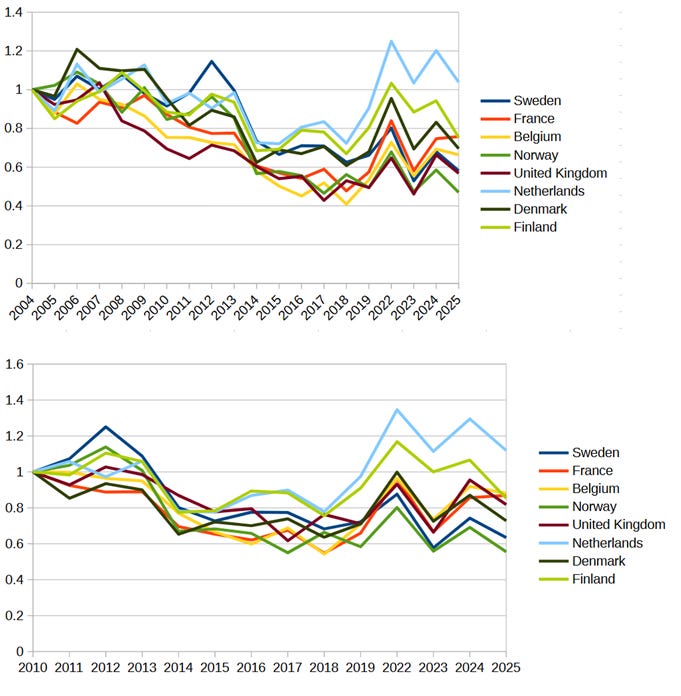
In these last two charts, Finland and the Netherlands (maybe also Denmark) stand out for showing an upward trend. That’s interesting, but doesn’t immediately connect to the downward trends in Spain and Italy. Maybe, since Finland and the Netherlands are northern European countries, this is simply a north-south gradient?
After this, I decided to switch to an absolute measure: box office per million population. Instead of comparing how each country does relative to others, this index shows how they do on a per capita basis6. Were the countries which showed an upward trend (Finland and the Netherlands) actually surpassing all others, or were they just catching up with the top per capita countries?
I was particularly interested in comparing each country’s per capita revenues to the UK’s, which I suspected had the highest per capita box office due to its cultural proximity to the U.S.
We’ll start with the northern European countries, and then proceed south (there are too many countries too fit them all in single chart).
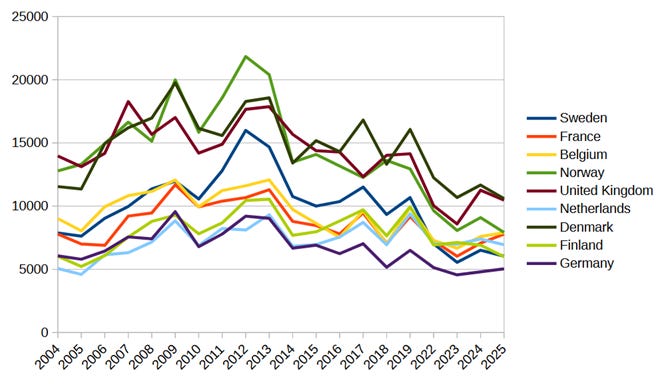
The United Kingdom didn’t disappoint me. Unsurprisingly, it had the highest box office per capita rate in 2004 and the second-highest at the end of the period. It also looks like Finland and the Netherlands went from a lower box office group, which they shared with Germany (why?), to a European mid-tier group. They were really just catching up to the mid-level countries, not pulling ahead.
Instead of proceeding to the next chart, let’s try something different and perhaps better suited to the per capita index we are now using: a map. Maps won’t show us downward or upward lines, yet by comparing a map from the beginning of the period with another from the end might help us to discern patterns more clearly. They will also look less crowded than a chart with 13 plot lines.
Since yearly box office data can be a bit noisy (notice the jagged lines in the previous charts), I’ll reduce the noise by averaging two years together for each map: the 2004-2005 box office per capita map and the 2024-2025 map. You may want to look at the right-hand map before looking at the left-hand map (darker is higher box office).
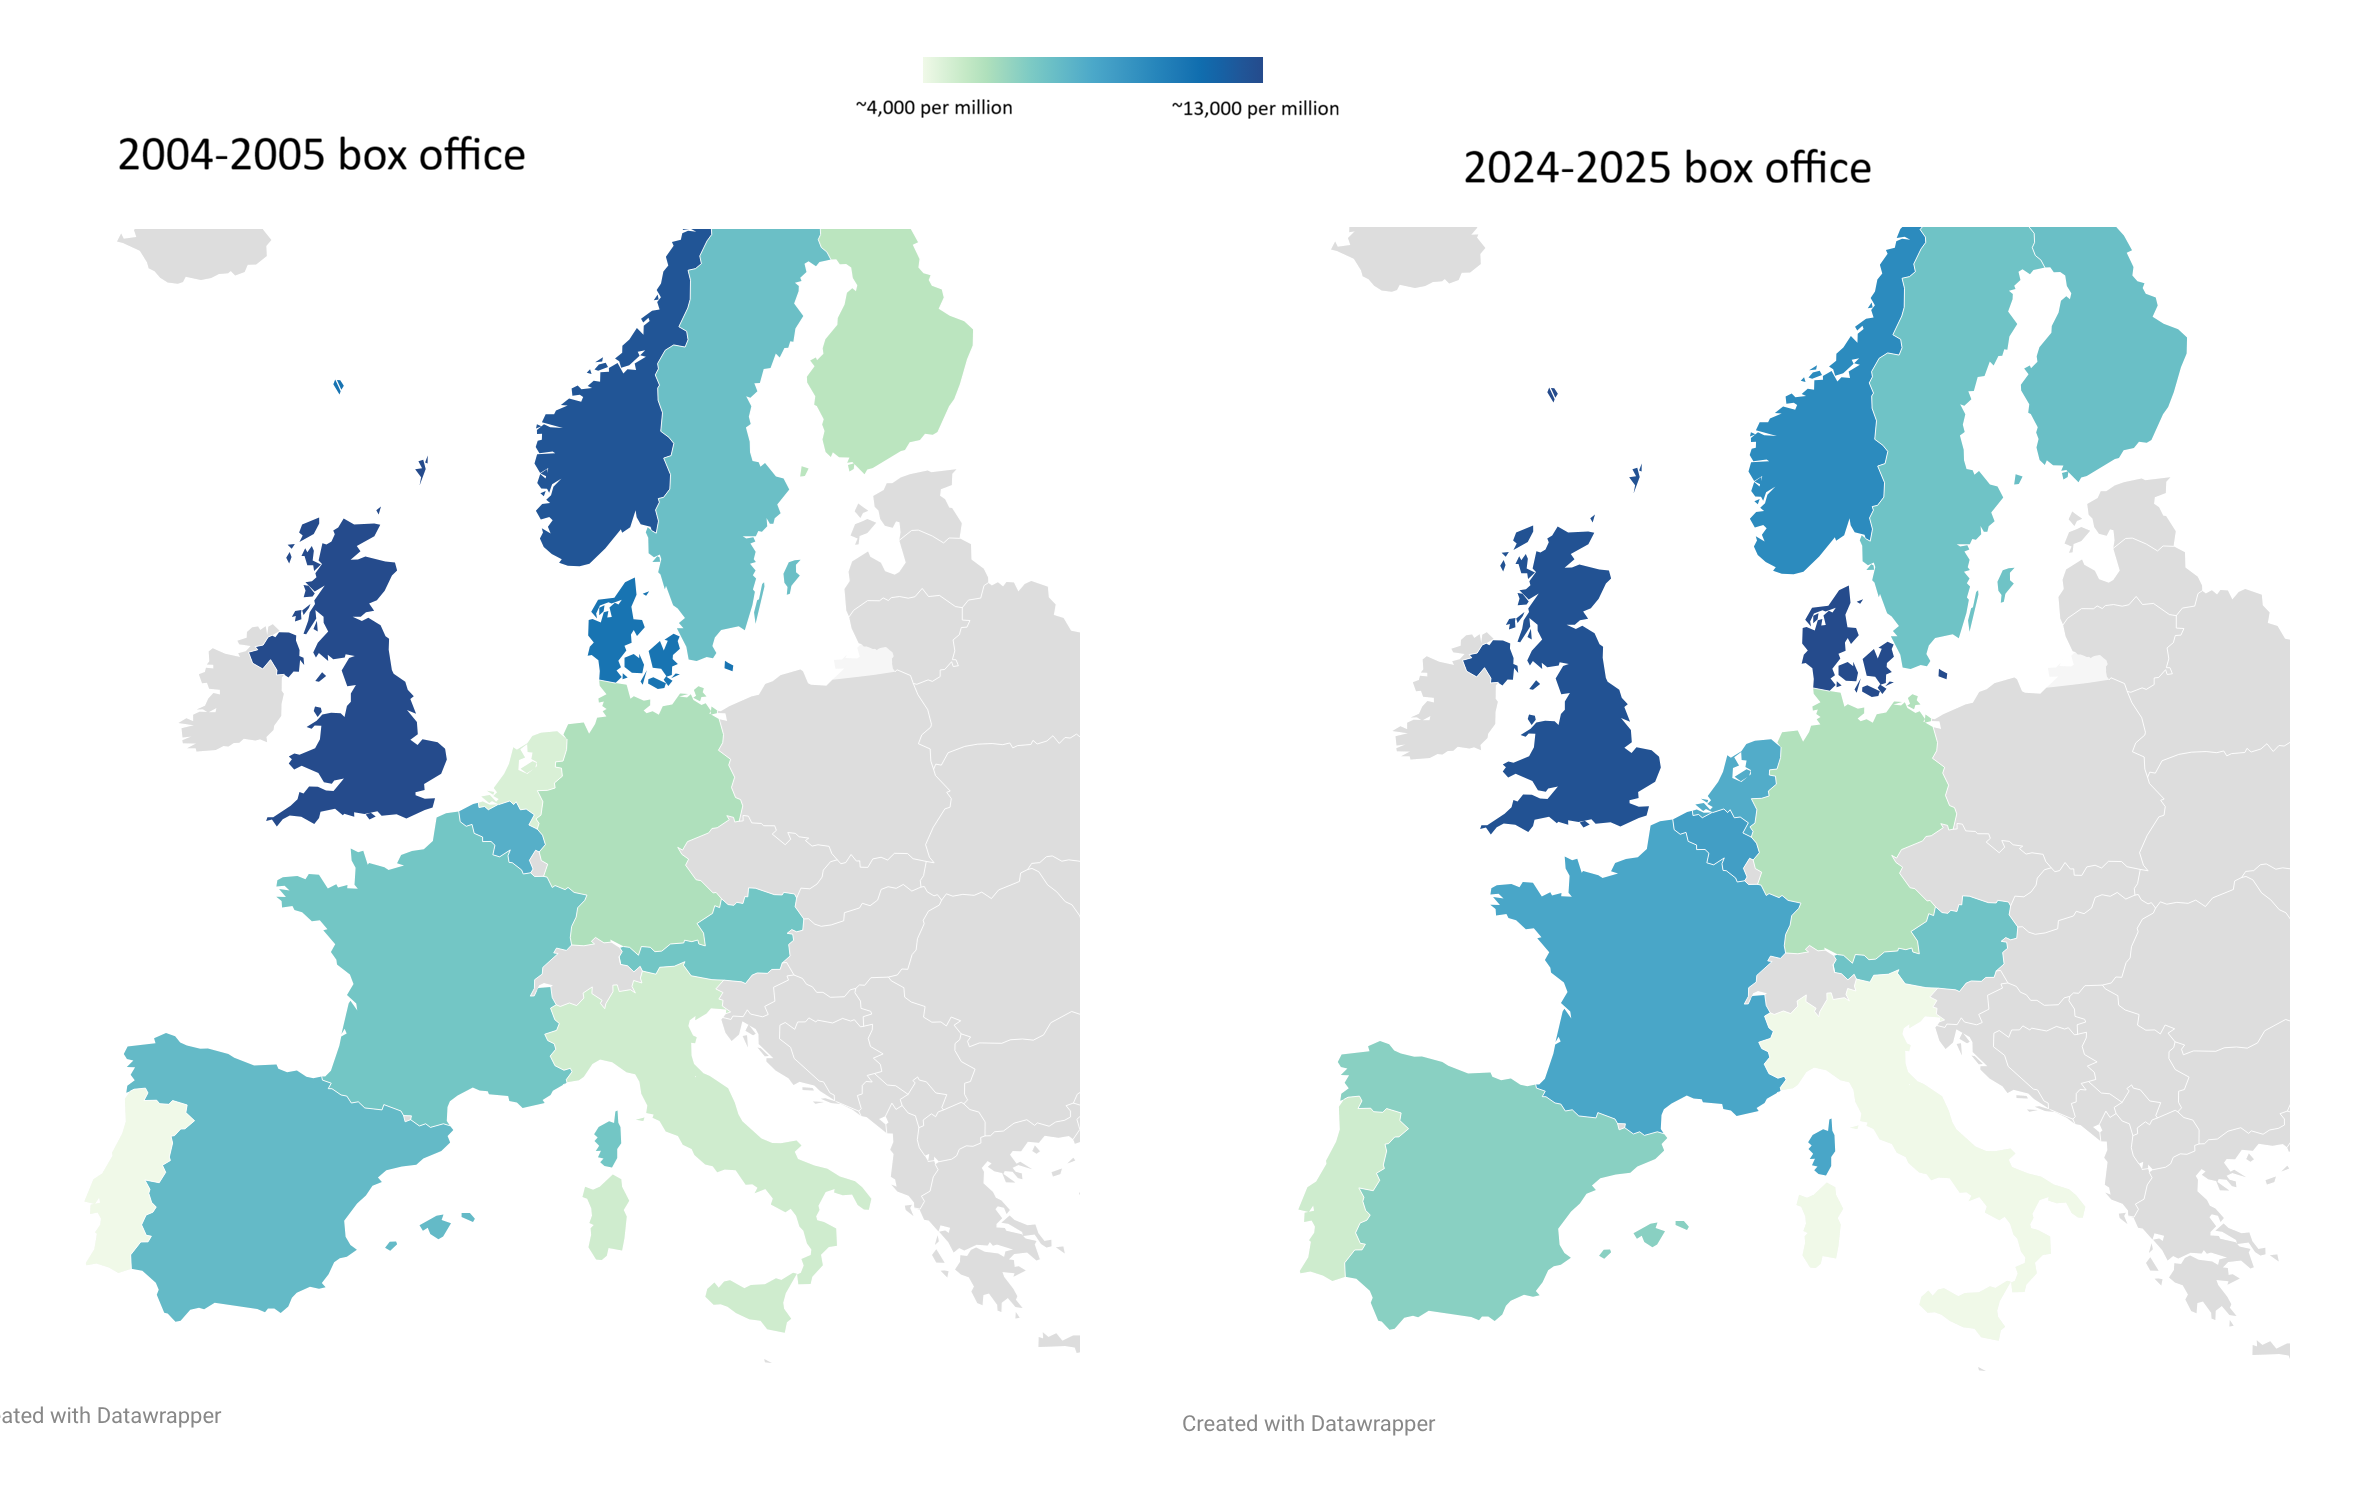
We can see again that the United Kingdom had the highest (darkest blue) box office rate in 2004-2005 and in 2024-2025. The general pattern in the 2024-2025 map appears to be that the more western and northern a country is (closer to the UK?), the higher its box office.
Given that pattern, Finland and the Netherlands are no longer surprising. The Netherlands especially - a small, cosmopolitan, mostly English speaking country right next to the UK - seems to have simply converged to the box office level one would expect of a country culturally close to the Anglo world. Maybe its 2004-2005 box office rate was too low?
Comparing Finland and Germany is also illustrative. At the start of the period their box office rates were similar, while by the end the more English-fluent, non-TV-dubbing Finland surpasses Germany by a large margin7 (I assume everyone agrees that there’s a strong correlation between not dubbing TV programming - using subtitles instead - and English language fluency).
Speaking of TV dubbing, France is the only dubbing country8 on those maps with a 2024-2025 box office rate above the average. If box office rates are a function of English fluency and cultural proximity to the US/UK, then France is arguably the only exception that would need to be explained9.
Also, if box office rates are indeed a function of those factors, then the Spanish decline we saw earlier is perfectly natural. In fact, Spain’s initial box office rate (2004-2005) was unusually high. And it wouldn’t surprise me if its rate declines further in the coming years, given it’s still high compared to Italy and Portugal, two countries where English fluency is also relatively low.
I wouldn’t want to suggest that English proficiency is the only factor influencing cultural proximity to America. Greece is a case in point: its level of English fluency is higher than that of Italy, Spain or Portugal, yet its box office per capita is lower than Italy’s in 2024-2025. I didn’t include it in the maps because its box office is missing for many movies10. To include Greece in the maps I would have to impute the individual figures, or correct its rate by using another country as a reference11. And even then, its low box office would make the maps significantly uglier.
I know what you are thinking. This “natural” box office rate, determined by cultural proximity to America, feels like cheating. Why wasn’t the early 2000s (or 1990s, or whatever) rate the “natural” one? My provisional, tentative explanation is: maybe as Hollywood’s international appeal declines relative to its domestic appeal (remember the falling international to domestic box office ratio), the countries showing the greatest box office drops are those that valued its international appeal the most. Conversely, the countries that show the smallest declines are those whose moviegoers’ tastes are more American.
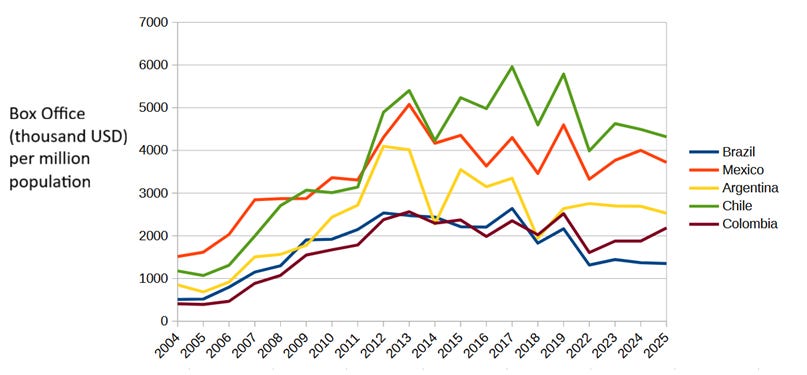
Also, what happened to Brazil? What does all this English fluency, cultural proximity, and international appeal stuff have to do with the Latin American trends we saw earlier? Well, let’s examine the box office rate per million population for our five aforementioned Latin American countries.
And let’s compare these box office rates with the approximate share of English-fluent population in each country.
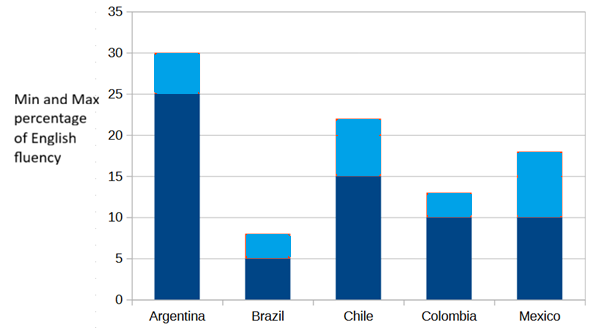
Beware that these are estimates produced by Grok, my AI assistant of choice, and should be taken with a grain of salt. That said, with the exception of Argentina, all the other countries follow the same pattern: higher English fluency predicts a higher per capita box office rate.
In fact, according to Grok (beware, etc.), Colombia has clearly improved its level of English proficiency more than Brazil in the last couple of decades12. And regarding Argentina, my working hypothesis is that its box office rate - lower than would be predicted by its level of English fluency - is being affected by its ongoing economic crisis13.
Maybe Hollywood’s (relatively) shrinking international box office is simply the result of most countries’ limited success in teaching English.
The differences in the ratios for years before 2025 are likely due to corrections made by Box Office Mojo to older data.
Excluding China. Total box office excluding China was $1.31 billion.
Zootopia 2 made $1.22 billion (excluding China), with 64.7% of its box office coming from international markets.
In the case of Chile, I had to impute the box office figures for a few movies.
But here’s the same chart starting in 2008 in case you want to see it:
Controlling for GDP does something similar (countries with larger populations tend to have larger economies), but not exactly the same.
Box office rate is around 30% higher in Finland. And my AI assistant of choice says English fluency is around 50%-60% in Finland and 35%-45% in Germany.
Austria does look a bit high compared to the other dubbing countries, but its rate is still below the average. Belgium is apparently split between a northern dubbing half (Flanders) and a southern subtitling half (Wallonia).
Maybe I’ll attempt an explanation in the future.
I also omitted Ireland from the maps because there are simply no figures for Ireland in Box Office Mojo.
In each comparison, I only include movies with figures for all the countries being compared. This didn’t affect the southern Europe box office controlled by GDP chart because the index it plots is relative.
In Grok’s own words: “Brazil has remained in the ‘Low Proficiency’ category for most of the last 15–20 years. Trend: Some improvement in the 2010s, especially among younger urban populations. Recent years (2023–2025) show stagnation or slight decline in the EF English Proficiency Index…. [Colombia has accrued] Steady gains since the early 2010s, thanks in part to government programs like ‘Colombia Bilingüe’. Colombia has improved its ranking in the EF English Proficiency Index“.
Yes, this implies economic conditions can have an influence in box office performance. But Brazil, Colombia and Mexico all have very similar per capita incomes.