
Rotten Tomatoes' suspicious audience scores, part 2
Digging a bit deeper into the data for RT's audience scores and marveling at the results

This is the follow up to my previous post where I analyzed audience scores for TV shows in Rotten Tomatoes (RT).
To sum up that post, I estimated the audience score for 343 TV shows using Rotten Tomatoes’ public reviews (ratings with a corresponding review) and got a distribution of Audience Score (AS) differences between RT’s audience score and my estimated audience score for each show.
Those AS differences follow an unsurprising normal distribution, but some TV shows do seem to have a very peculiar value for AS difference and some unusual characteristics. I focused on the shows Obi-Wan Kenobi S01 and Ms Marvel S01 in the previous post and in this post I would like to present some more data in order to get a clearer picture of what’s going on with Rotten Tomatoes’ audience scores.
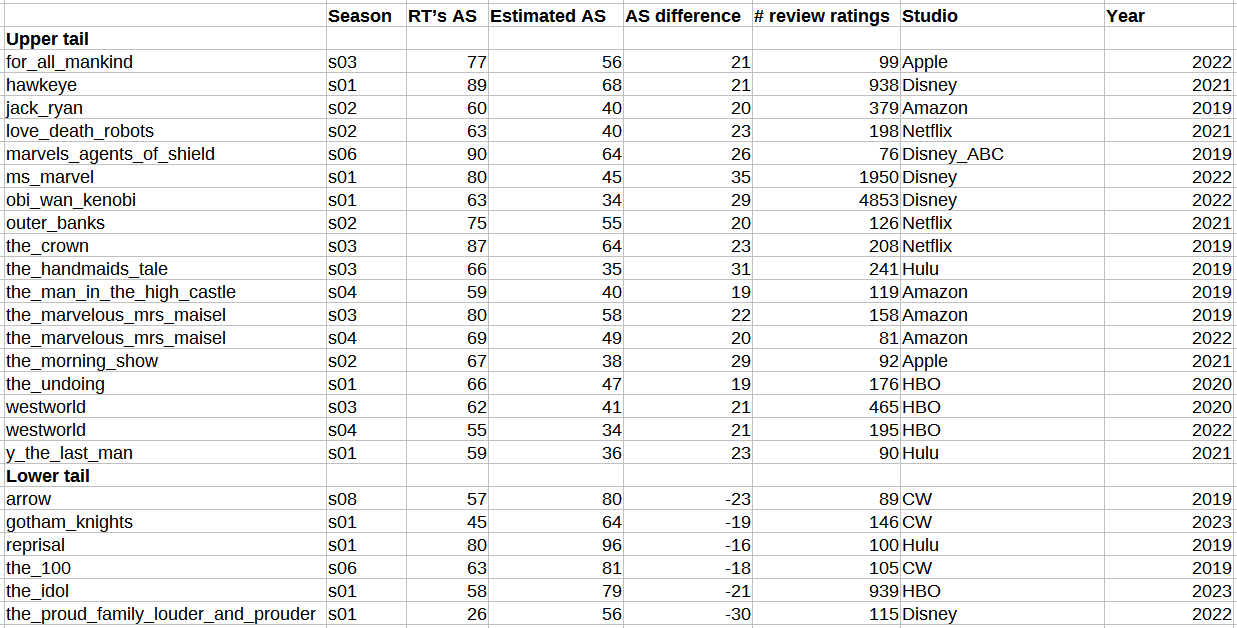
If you read the previous post you might remember I mentioned the fact that obi_wan_kenobi S01 and ms_marvel S01 have a very large number of review ratings, and how unusual I thought that was considering their AS difference. I’ll show the upper tail and lower tail of the AS distribution again before explaining why.

The bigger the better
Why do I mention the fact that obi_wan_kenobi and ms_marvel are the shows with the larger number of review ratings in the upper and lower tails ? Because the bigger the sample, review ratings, the better I would expect that sample to reflect the true distribution of all ratings.
The only shows in the lower or upper tail with a number of review ratings approaching that of obi_wan_kenobi and ms_marvel (4853 and 1950) are the_idol and vampire_academy (939 and 1073), but they have an AS difference of -21 and -12 respectively. With many more review ratings obi_wan_kenobi and ms_marvel have an AS difference of 29 and 35 respectively.
So obi_wan_kenobi S01 and ms_marvel S01 already look suspicious, but I want to make sure my conjecture that bigger samples mean smaller AS differences is true. Here I graphed the absolute difference in audience score for each show (if AS difference is -6, then absolute AS difference is 6) against the number of review ratings for that show.
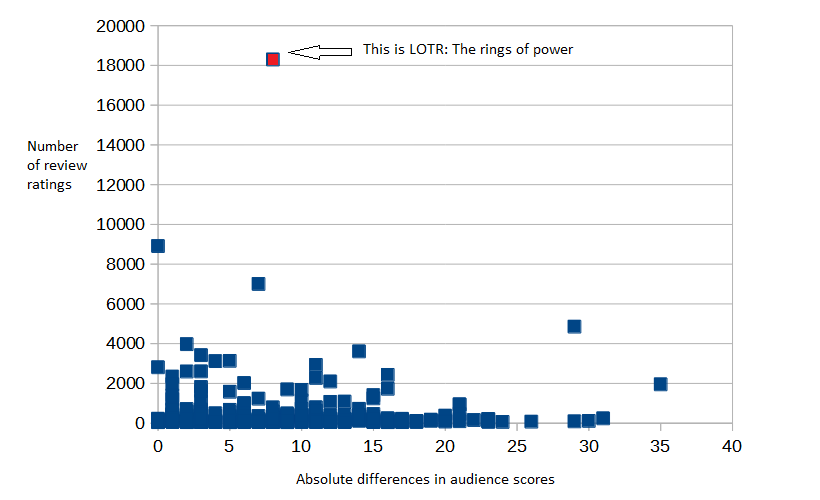
That graph doesn’t show a very clear picture of what I’m trying to figure out, mostly because the_lord_of_the_rings_the_rings_of_power is an outlier in terms of number of review ratings, even though its AS difference is “only” 8. Here’s the same graph without the_lord_of_the_rings_the_rings_of_power.

As you can see, most of the dots are very close to the Y axis (absolute difference close to zero) or very close to the X axis (small number of review ratings, but always 50 or more). I took the liberty of coloring the dots that clearly diverge from that pattern: in green TV shows from the lower tail and in red TV shows from the upper tail. The one green/red dot is actually two dots almost on top of each other.
As you can probably guess, the one of green dot corresponds to the_idol S01. And the 10 red dots are these shows, from right to left:
ms_marvel S01 (Disney)
obi_wan_kenobi S01 (Disney)
hawkeye S01 (Disney)
the_falcon_and_the_winter_soldier S01 (Disney)
the_witcher S02 (Netflix)
game_of_thrones S08 (HBO)
willow S01 (Disney)
wandavision S01 (Disney)
the_wheel_of_time S01 (Amazon)
she_hulk_attorney_at_law S01 (Disney)
If you know a thing or two about the streaming and television industry you might realize that a pattern is starting to emerge.
Looking at the last sixth show on that list, I was reminded of the time in 2019 when game_of_thrones S08 came out and my first thought was “I’m so happy that it ends and people will stop bugging me about watching it“, but soon I noticed a certain unhappiness in those same people that had been bugging me about watching it. Season 8 of game_of_thrones seems to have been very divisive among its enduring audience and I’m tempted to think that divisiveness might have something to do with my AS estimate being so different from RT’s AS (16% vs 30%). So in order to check if there was something suspicious not just with season 8 of game_of_thrones but with the show in general I estimated the AS from review ratings for all seasons of game_of_thrones, from S01 (broadcast in 2011) to S07 (2017). These are RT’s AS and estimated AS for those 7 seasons:
S01: RT 96%, estimated 92%, AS difference is 4.
S02: RT 96%, estimated 93%, AS difference is 3.
S03: RT 97%, estimated 93%, AS difference is 4.
S04: RT 97%, estimated 96%, AS difference is 1.
S05: RT 90%, estimated 81%, AS difference is 9.
S06: RT 92%, estimated 88%, AS difference is 4.
S07: RT 81%, estimated 69%, AS difference is 12.
I still feel a bit worried about the fact that AS differences increase from the first seasons to the last seasons. But only a little bit.
About the_witcher S02 (broadcast in 2021), it turns out that the_witcher S01 (broadcast in 2019) is part of the sample of 343 shows, and so I can check the AS difference for the_witcher S01. It’s zero. RT’s audience score is 90% and my estimated audience score for 8911 review ratings is 90%.
Leaving aside game_of_thrones and the_witcher, all other shows from the red dots list except the_wheel_of_time are Disney shows. That seems odd. Is there something unusual about Disney ?
This is the distribution of AS differences for all Disney TV shows.

The two shows in the extreme left of that graph are the_proud_family_louder_and_prouder S01, which I’ve already talked about, and the_proud_family_louder_and_prouder S02 which has a very similar distribution of ratings curve as S01 (zero from 1.5 stars to 4 stars). Even if you don’t take out those two shows that distribution looks very lopsided.
Something you might have noticed when I described the studios that produced or broadcast the 343 shows in the sample is that I considered ABC as a separate studio from Disney. In fact Disney is a very large entertainment conglomerate with many divisions and subdivisions, and one of those divisions is ABC Entertainment. Other divisions are Lucasfilm, the producer of obi_wan_kenobi, and Marvel Studios, the producer of ms_marvel, hawkeye and the_falcon_and_the_winter_soldier.
The next table lists all Marvel Studio, Lucasfilm and Disney shows in the sample.

All audience score differences in red have a one standard deviation from the mean or more, and all shows in red were produced by Marvel Studios and broadcast by Disney+. Notice that shows from Disney (but not Marvel Studios nor Lucasfilm) mostly have a negative AS difference and many of them have an AS difference close to zero.
All audience scores from 60% upwards are considered good (red striped popcorn bucket) by Rotten Tomatoes. All audience scores below 60% are considered bad (green striped toppled popcorn bucket) by RT. If you were a Disney executive, how low would Rotten Tomatoes’ audience score need to be for you to worry about the viewership or profitability of your show? According to RT, every Marvel Studios show in the sample, every show from 2019 to this day except she_hulk_attorney_at_law, has an RT audience score of 80% or more.
With everything I’ve said thus far, I think it’s time to formalize what I think might be happening with Rotten Tomatoes’ audience scores.
The hypotheses
Hypothesis 1: Rotten Tomatoes is altering audience scores knowingly at the request of studios (or streaming services, or show’s producers).
Hypothesis 2: Some studios (or some streaming services, or some producers) are gaming Rotten Tomatoes’ rating system for some shows, and Rotten Tomatoes honestly doesn’t know this gaming happens or intentionally ignores it.
Hypothesis 3: I’m reading too much into this. It’s normal that the estimated AS for review ratings is different than the one for all ratings, and some TV shows will deviate a bit too much from the mean.
I’ll try to tackle hypothesis 2 before talking about hypothesis 1.
One thing that bothered me from the moment I saw the distribution of AS differences was the fact that the mean of the distribution was so high at 6 percentage points. Or at least to me that seemed high. It seemed reasonable that review ratings were not a perfect sample of all ratings but I was expecting a distribution of AS differences with a mean of 1, -1 or maybe 2.
While checking subsamples of the main sample I noticed the distribution of AS differences for shows from the CW and Peacock_NBCUniversal was definitely different than the distribution for all shows. Its mean is 1.7. That mean is closer to what I would have expected before starting my analysis.
This is probably a good moment to mention that Rotten Tomatoes is owned by the CW (WBD) and NBCUniversal (Comcast).
If I had used a 1.7 mean in the previous analysis, the upper and lower tails table would be this.
hawkeye S01 now shows up in the upper tail. No surprises there. But it’s interesting that several season 2, season 3 and season 4 shows are now included in the upper tail of that table. This gives us a chance to test Hypothesis 2, assuming some studios are gaming RT systematically, by looking at several seasons of the same show.
Take the_morning_show for example. Season 2 has a 29 percentage points difference between RT’s AS and the estimated AS. But season 1 is also part of the sample and it’s AS difference is just one percentage point (91% vs 90%). It seems a bit unlikely that someone went to the trouble of adding fake ratings for S02 in order to increase its audience score but didn’t do the same for S01.
Here’s a table with all seasons for another couple of those shows in the upper tail.
You’ll notice there are still no CW and NBCUniversal shows in the upper tail, but there are some HBO shows (westworld, the_undoing).
In order to test the hypothesis that the absence of CW and NBCUniversal shows in the upper tail is just a coincidence I checked for CW or NBCUniversal shows in the upper tail defined by just one standard deviation from the mean (AS difference of 15 or more) instead of two standard deviations. It turns out that good_girls S02 (NBC Universal) and manifest S04 (NBC Universal) are the only shows that are more than one standard deviation over the mean produced by either the CW or Peacock_NBCUniversal. In fact, Manifest was originally an NBC show, but Wikipedia says:
The series was added to Netflix shortly before it was canceled and immediately topped the viewing charts, persuading Netflix to renew Manifest for a fourth and final season
So, by the time manifest S04 was released it was no longer an NBC show, it was a Netflix show. That means that just one show from the CW or Peacock_NBCUniversal is in the upper tail of the distribution of differences, even taking the most generous definition of the upper tail, and it has 57 review ratings so it barely qualified to be considered in this analysis.
To me that doesn’t look like a coincidence. It seems that a show being produced by a studio with no direct relation to Rotten Tomatoes increases the chances of that show having a suspicious Rotten Tomatoes’ audience score, higher than the estimated audience score, and for some studios it’s a dramatic increase. And that would refute Hypothesis 1. If some studios or producers are gaming RT they would probably be aware it’s not in their best interest to mess with a company controlled by their own employer.
Is Hypothesis 2 correct? Are some producers or studios gaming Rotten Tomatoes’ rating system for some shows? I think I’ve presented all the evidence available, at least all the evidence publicly available, for you to make your own judgement.
And if you found this post interesting or at least entertaining.

Please subscribe.