

The Programme for International Student Assessment (PISA) is a test that measures mathematics, science, and reading performance of students from more than 70 countries. Its results allow us to compare academic performance between countries, but also between different regions within a country.
PISA last took place in 2018 and 2022, yet in this analysis I’m going to focus on Spain’s 20151 results for a very simple reason: I want to compare Spain’s 21st-century regional academic results with 19th-century regional literacy rates. Using the latest results would not be fair, given that in some Spanish regions today over one-third of primary and secondary students come from an immigrant background. By analyzing the 2015 data, I minimize the effect of international migration on the student population.
There’s also the issue of the large-scale internal migrations that have taken place in Spain over the past century and a half. The population of 2015 Madrid was not primarily descended from the people who lived in Madrid in 1860 or 1877, but as long as I exclude Madrid and maybe Catalonia - the two main destinations of Spanish internal migrations - I can confidently compare regions such as the Canary Islands or Galicia in the late 19th century with the same regions in 2015.
So here’s a map of Spain showing 2015 PISA results by region (Autonomous Community).
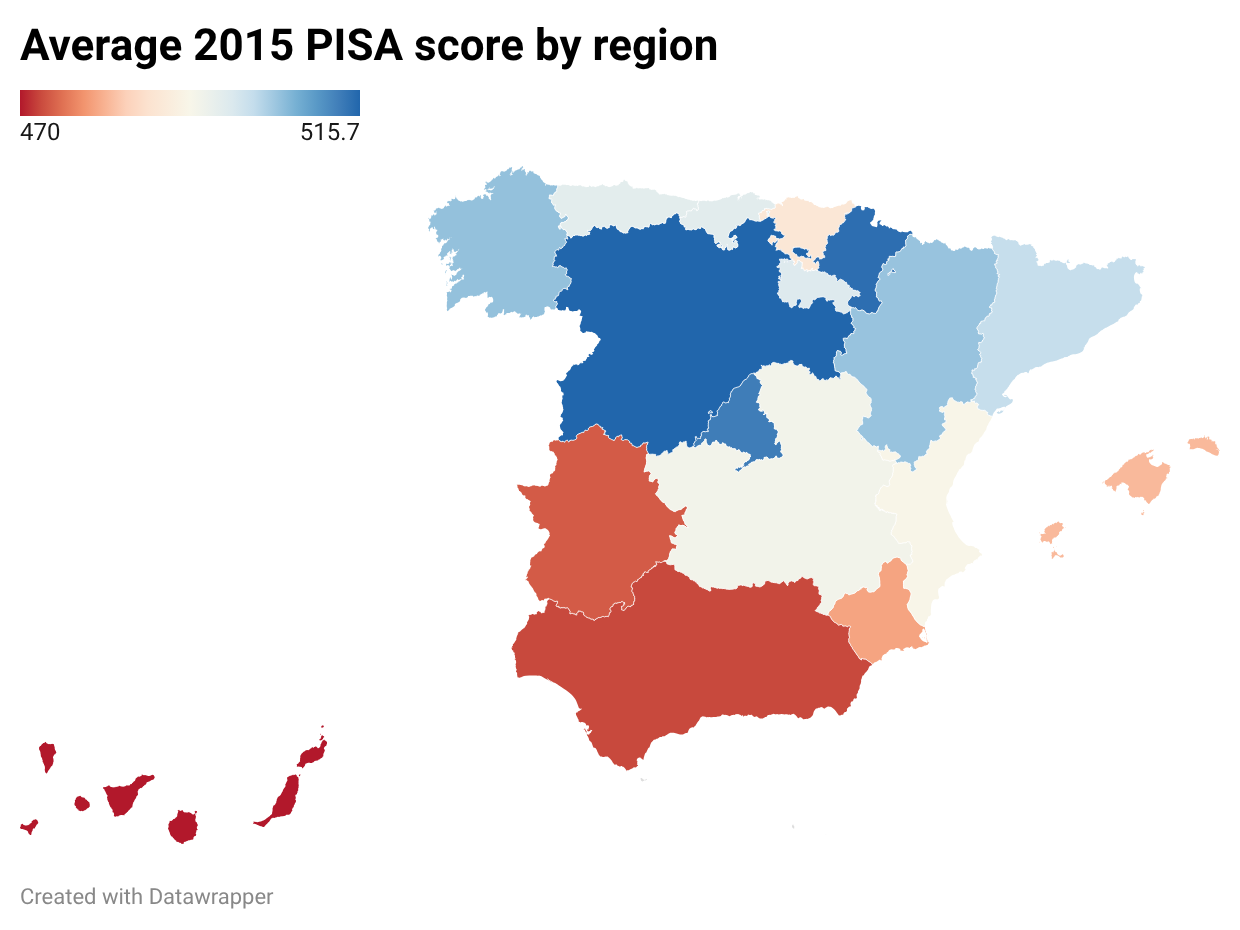
The difference in average score between the highest scoring regions (Navarre, Castile and Leon) and the lowest scoring one (the Canary Islands) is equivalent to the 2015 academic performance gap between South Korea and Croatia.
A few other notable points that stand out from the above map:
Northern Spain performs generally better than Southern Spain.
Galicia (in the northwest) and Catalonia (in the northeast) do slightly worse than the rest of Northern Spain.
Higher PISA scores generally correlate with higher per capita income. Given this, the Canary Islands’ weak performance is unsurprising. The two notable exceptions to this pattern are Catalonia (see footnote 1) and the Basque Country (which scores below the national average2).
I’m not trying to make a specific point about the Canary Islands in this post, so I won’t go on at length, droning on about the archipelago’s low academic performance and its implications for certain Latin American countries. At least not now. Instead, I want to make two observations: first, this pattern is similar to the one seen in Italy:
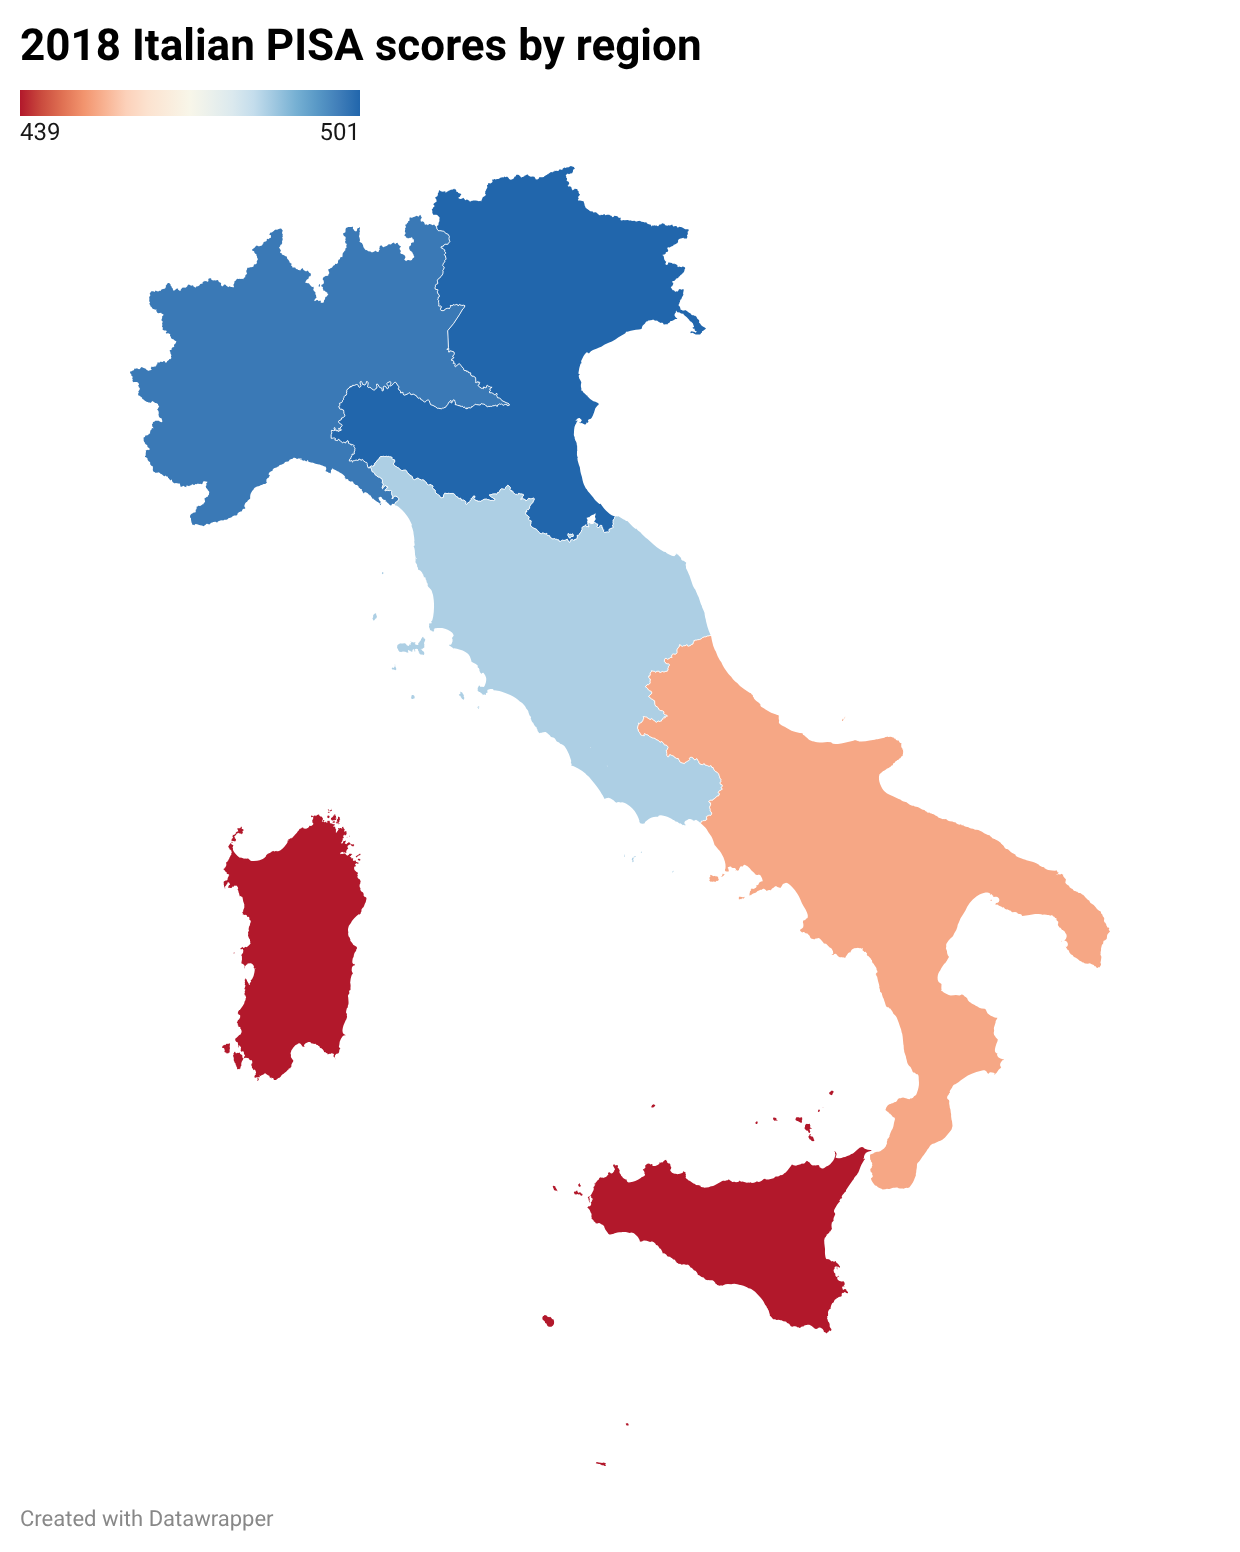
And second, this pattern has a clear historical precedent in 19th-century Spain.
The 19th century was a period of rapidly increasing literacy across Western Europe, and Spain was no exception to this trend. But just like literacy rates varied substantially between European countries, large differences in literacy also existed between Spanish regions. In 1860, even the most literate Spanish provinces had adult illiteracy rates ranging from 35% to 45%, roughly the same range as France and Belgium at the time.
We know this because the 1860 Spanish census, and all later 19th-century censuses, recorded the number of literate and illiterate3 people in each Spanish municipality.
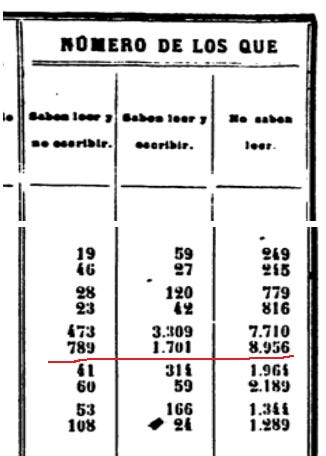
The numbers recorded include the entire population though, not just adults. Since children aged 0-10 accounted for 23%-26% of the total population, we have to adjust Spanish raw illiteracy rates - basically removing children aged 0-10 from numerator and denominator - to compare them with adult illiteracy rates in other European countries4. For example, a Spanish province with a raw illiteracy rate of 60% would have had an adult illiteracy rate of around 46%-48%.
We don’t need to adjust Spanish illiteracy rates when comparing provinces within Spain though. Simply presenting the raw rates on a map allows us to clearly see the differences between provinces and identify any geographic patterns that may emerge. Here’s the 1860 illiteracy rates map:
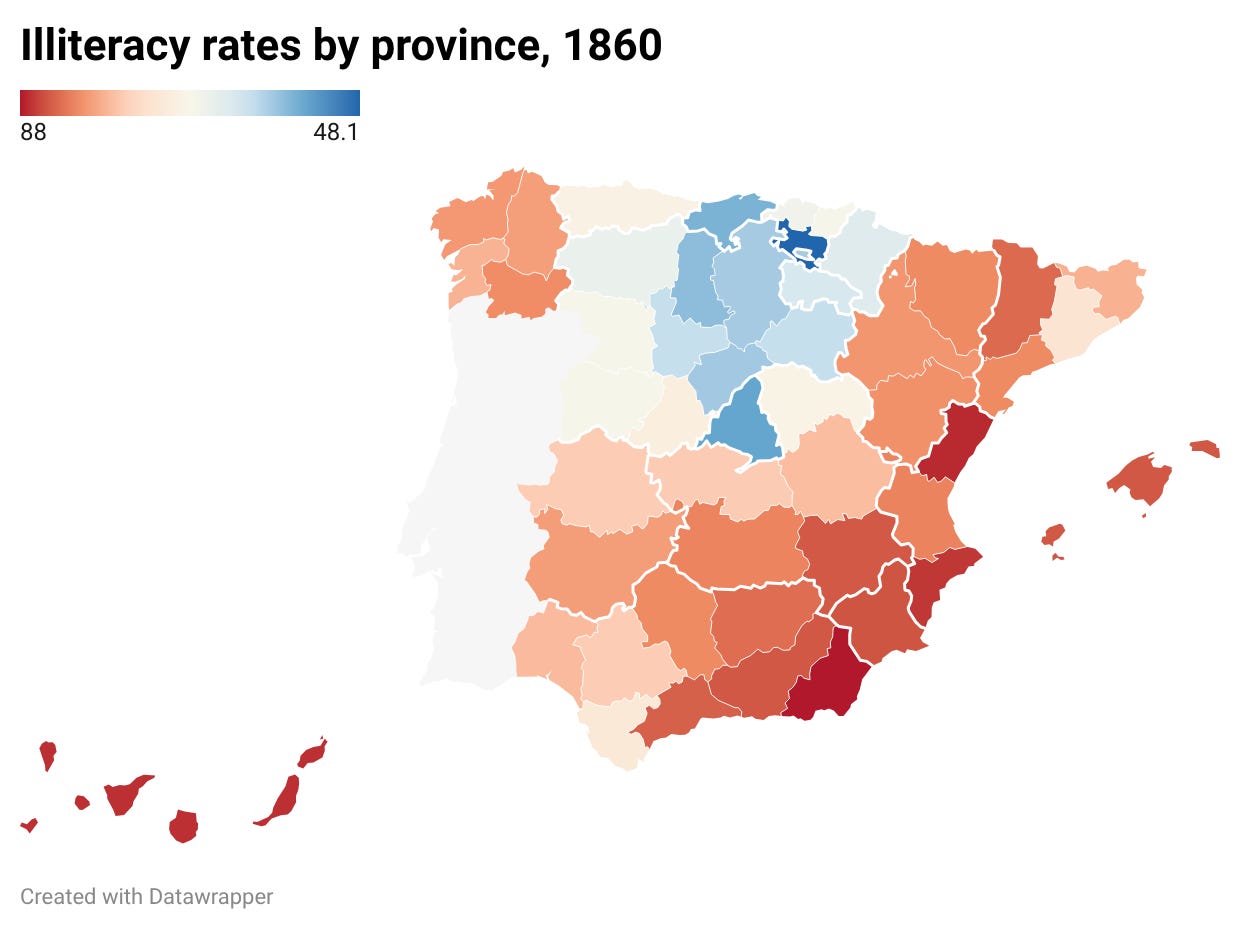
As you may have guessed, it looks kind of similar to the 2015 PISA scores map. Before analyzing this map in more detail, let’s see the equivalent map for the 1900 census, at the end of the 19th century.
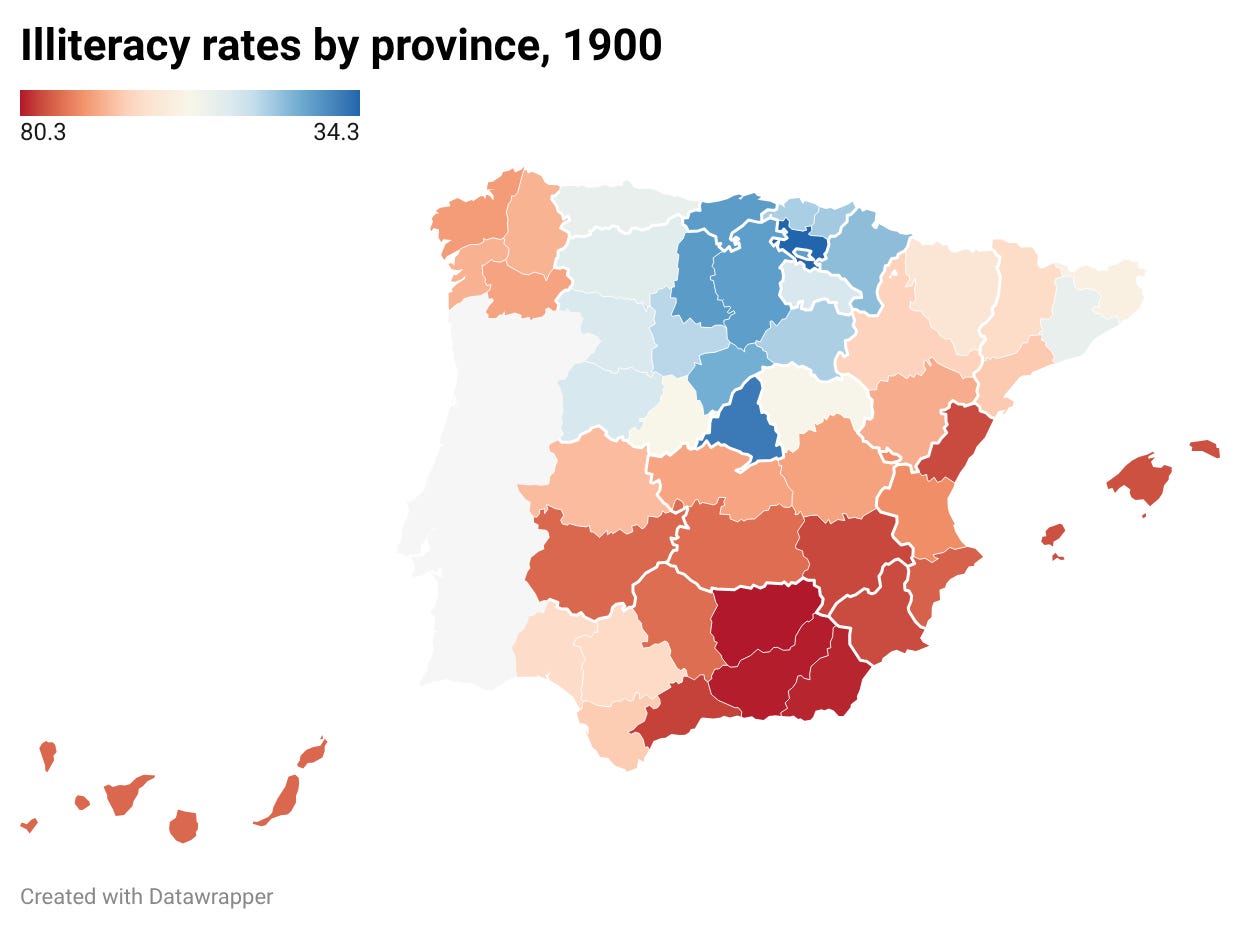
Although the range of illiteracy rates has shifted downwards (from 48-88% to 34-80%), the geographic pattern remains roughly the same at the end of the century, with southern and Mediterranean Spain - along with Galicia - still showing lower literacy. Spain was slowly converging towards the literacy levels of the rest of Western Europe.
Besides the general decline in illiteracy, a few other points stand out:
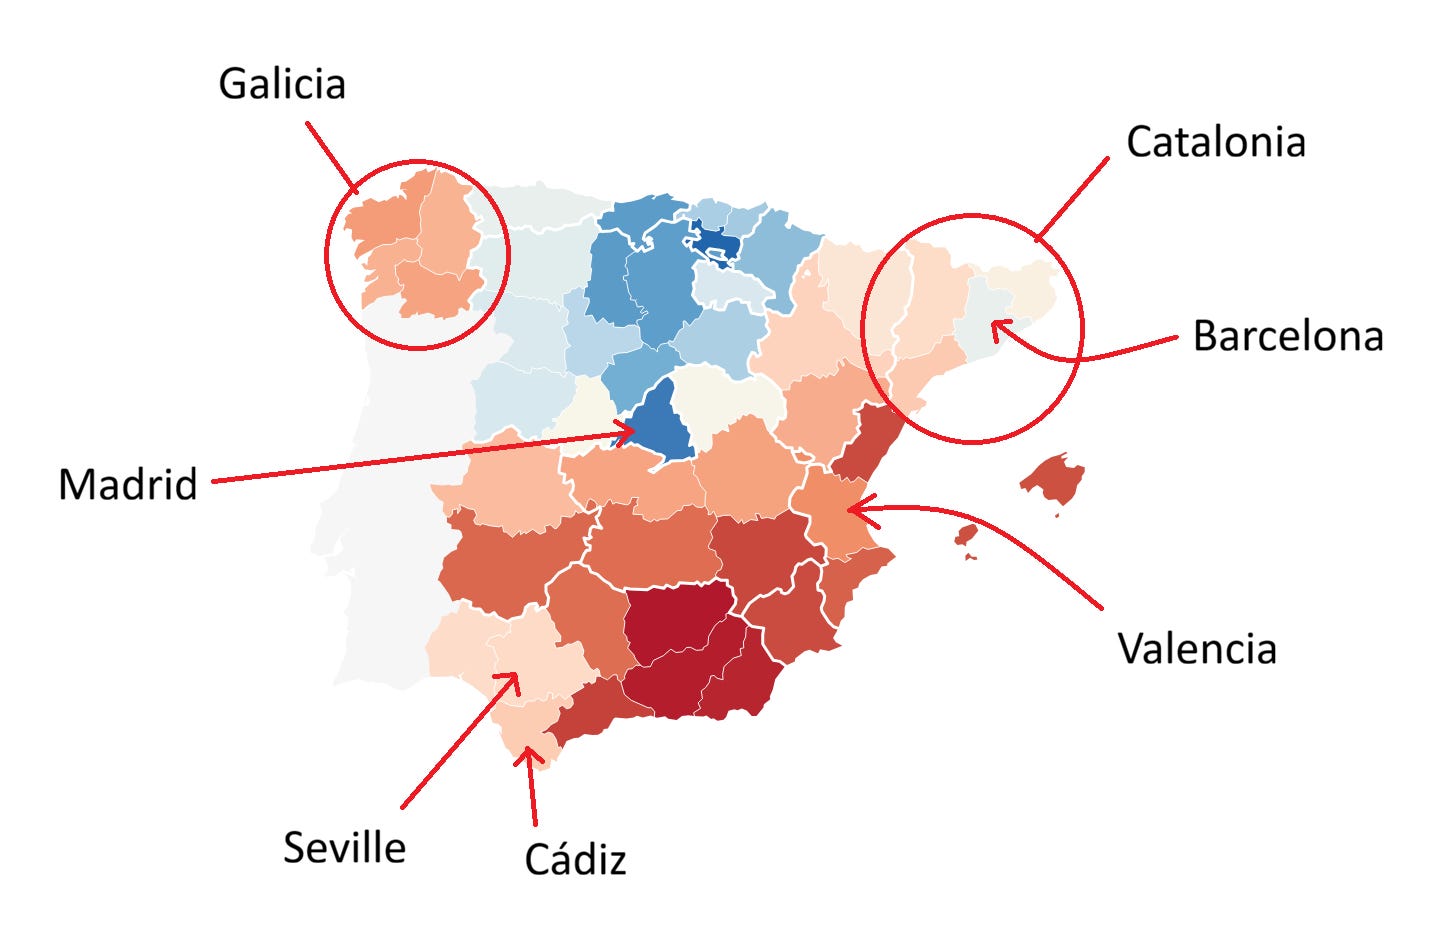
Among the low literacy provinces of Mediterranean Spain, two provinces seem to stand out as exceptions: Barcelona, home to the second-largest Spanish city at the time, and the province of Cádiz (see map here5). By 1900, Seville and perhaps Huelva also seem to diverge from the general Mediterranean pattern.
Galicians, Valencians and Catalonians speak their own languages. This might partly explain their lower levels of literacy, given that literacy was assessed in standard Spanish (Castilian).
Cities enjoyed higher literacy. They had the resources that villages and small towns lacked, and this allowed them to build schools, hire teachers, and develop the primary education systems that eventually led to universal literacy. In contrast, rural villages often had to pay their own teachers if they wanted to establish a school. This explains why Spain’s largest cities (Madrid, Barcelona, Seville and Valencia) raised the average literacy rate of the provinces they were located in (see map in footnote 5).
Although this is hard to see in the above maps, literacy did not improve at the same speed across all provinces. While the Basque province of Gipuzkoa decreased its illiteracy rate by more than 20 percentage points from 1860 to 1900, the Andalusian province of Jaén reduced its illiteracy rate by only three percentage points. The following map illustrates this more clearly.
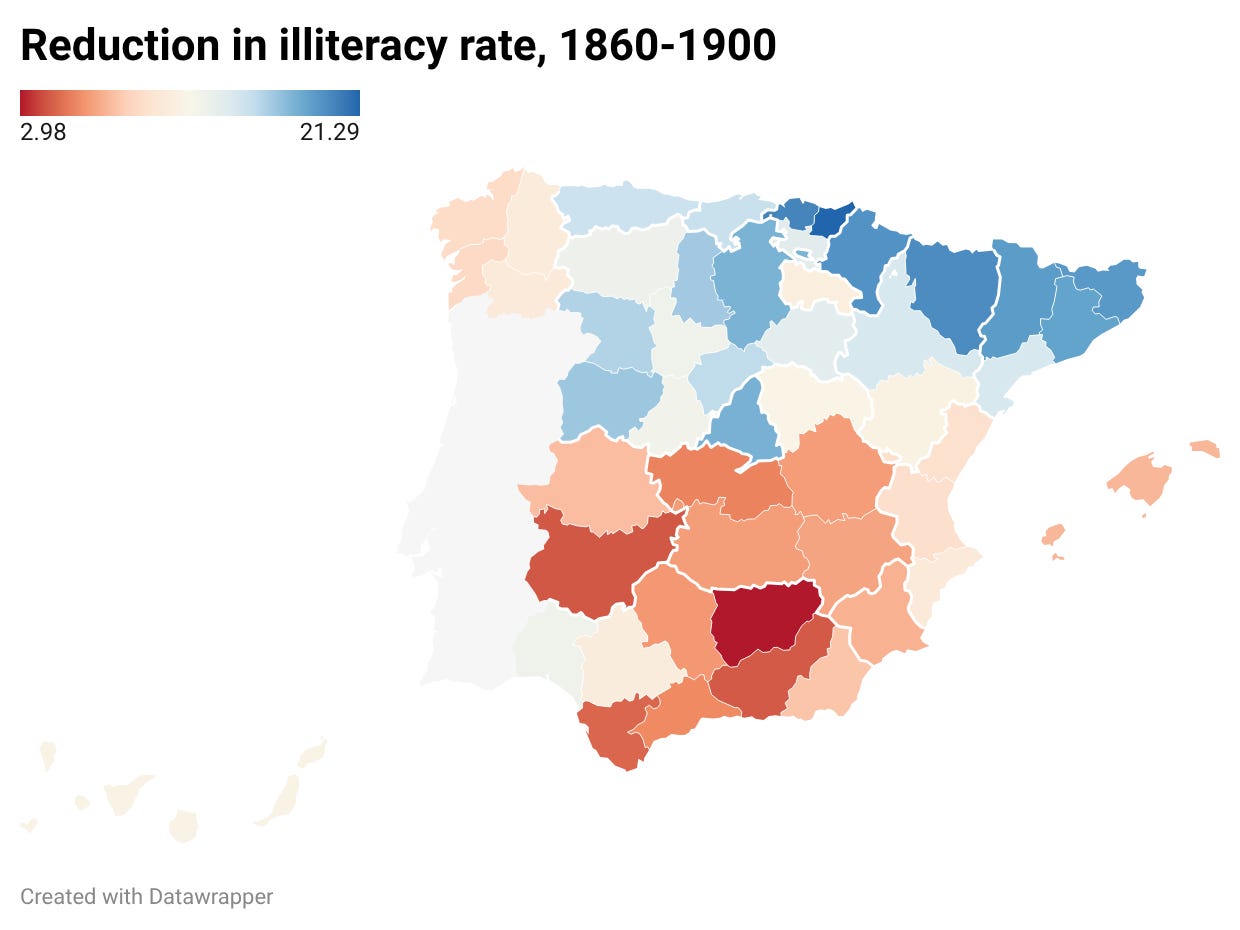
You can see that the geographic pattern of literacy improvement is not exactly the same as the patterns of 1860 or 1900 literacy, but it’s nevertheless broadly similar: Northern Spain mostly in blue and Southern Spain in red. Southern Spain began the period with lower literacy levels in 1860 and improved more slowly, while Northern Spain started with higher literacy and improved faster. The main differences between the 1860 literacy map and the 1860–1900 improvement map are are that literacy in Catalonia and Aragón expanded a lot in the second half of the 19th century, and the province of Huelva, in the southwestern corner of Spain, also improved substantially during this period.
We can very roughly predict 21st-century academic performance in Spain’s regions by looking at 19th-century literacy rates and the speed of literacy improvement; with the notable exception of Galicia.
Galicia
This brings me back to the major advantage that cities had over rural areas in expanding literacy. Galicia, despite having 11.5% of Spain’s total population (1.8 million), had no major cities in its territory. Its largest city, La Coruña, had only 30,000 people. While other regions were similarly not very urbanized, as you can see in the chart below, only Galicia faced the additional disadvantage of speaking a language other than standard Castilian Spanish.
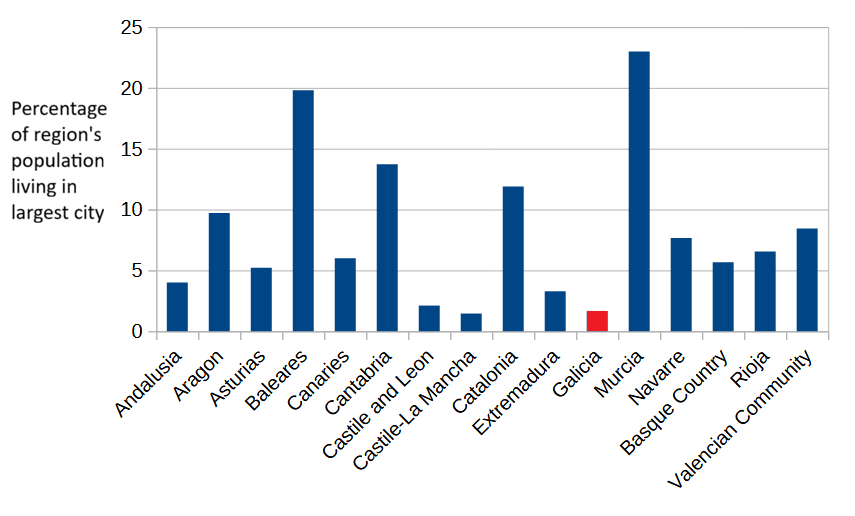
Maybe lower urbanization is just an effect of differences in regional size, both in population and area? Larger regions might have several medium-sized cities instead of one large dominant city. Galicia would be a clear example of this: it is a relatively large region comprising four provinces and had the third-largest population in Spain in 1860.
To test this, I calculated the percentage of each province’s population living in its main city. Only three provinces had less than 3% of their inhabitants in the main city (national average exceeded 6%): Pontevedra, Ourense and León. Pontevedra6 and Ourense are part of Galicia, while León province borders the region. Galicia was indeed one of the least urbanized regions of Spain, if not the most.
So, let’s try a fairer comparison of 1860 regional illiteracy rates. To be fair to the less urbanized regions, I’ll average the rates from each region’s main cities. For Galicia, this urbanized illiteracy rate will be the average of its four provincial capitals7. And in the case of single-province regions, such as Navarre, their urbanized illiteracy rate will simply be the rate of its main city. Here are the results:
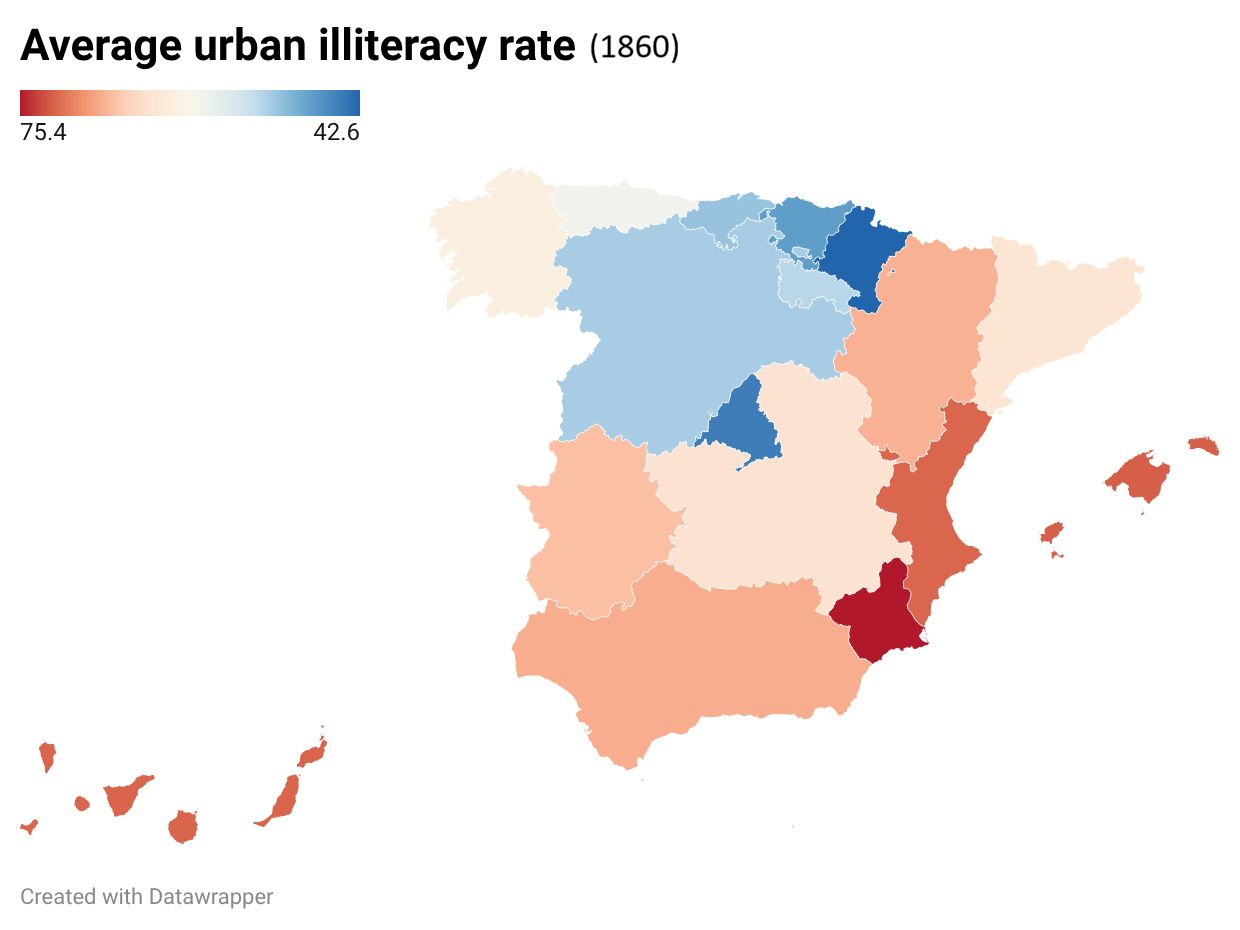
Even so, Galicia still looks kind of average in this last map. Just to make sure that big cities weren’t distorting the result8, I replaced every city with more than 55,000 people9 (of which Galicia has none) with the second-largest city in the same province. Here’s the adjusted map:
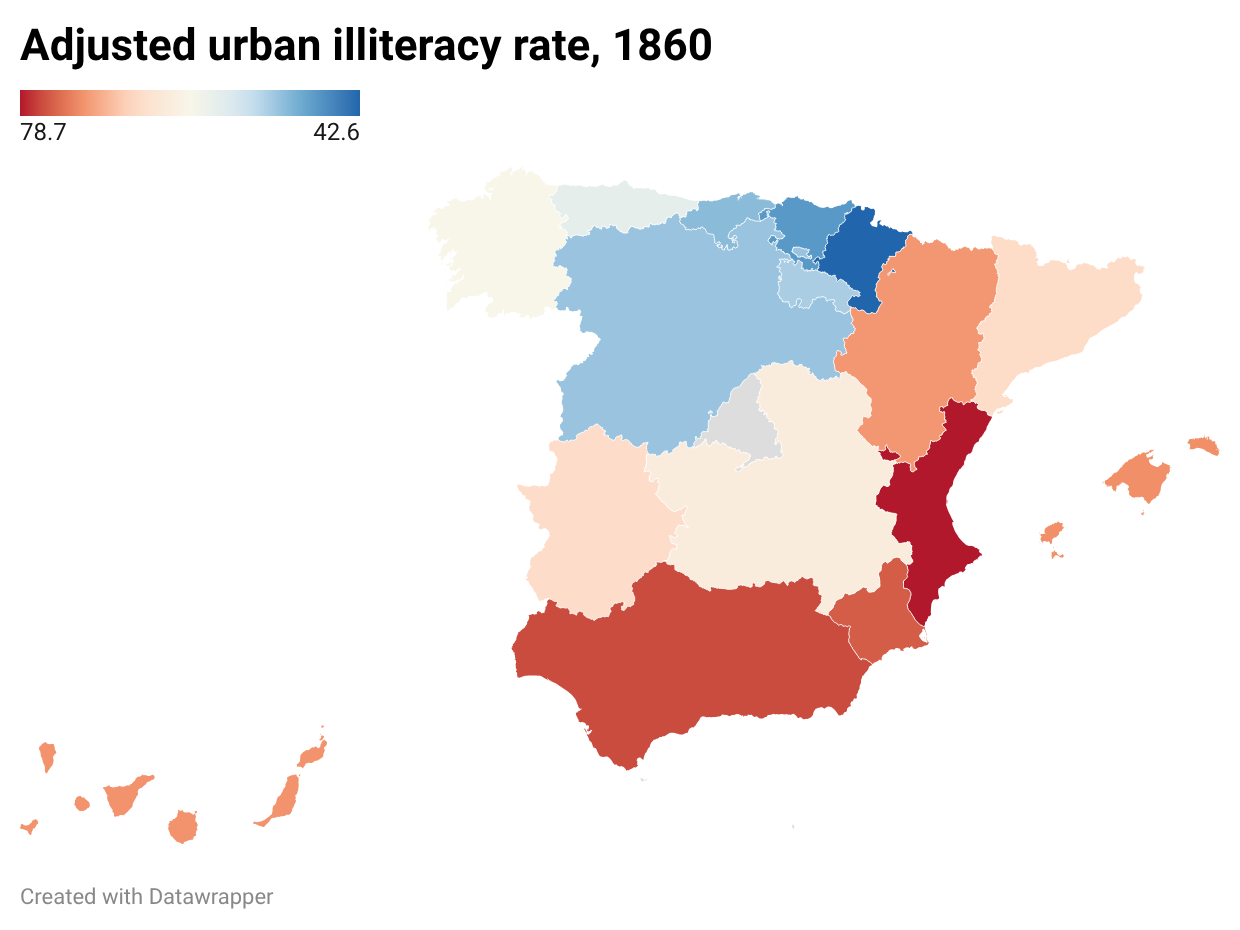
This map looks somewhat closer to the 2015 PISA results map, although Catalonia, Valencia and Galicia still look slightly worse than expected, but that is likely due to the use of their local languages10; and Aragón also appears less literate than it “should”, though I don’t have a good explanation for this case.
Beyond the visual similarity between the maps, can we be sure that 19th-century illiteracy predicts current academic performance? Well, yes. The correlation between adjusted urban illiteracy rates in 1860 and 2015 PISA scores is -0.609. That’s a fairly strong correlation and suggests that 19th-century literacy rates do have some predictive power. And the correlation between unadjusted urban illiteracy rates and PISA 2015 is actually stronger: -0.636.
Furthermore, if I exclude the three regions with their own local languages, the correlation coefficient rises to -0.703. This makes me confident in the existence of a link between 19th-century literacy and PISA scores, and in a deep historical origin for the academic disparities between Spanish regions. Perhaps deeper than the colonization of the Americas.
(You can check all the numbers at this link. I should probably upload my calculations more often)
The main change in regional results from 2015 to 2022 has been a general drop in average scores in every Spanish region, with the largest drop in Catalonia (501 to 469) and the smallest one in Asturias (497 to 495).
However, in the 2012 version of PISA, the Basque Country achieved the fifth-highest average score. I didn’t use data from the 2012 version in this analysis because it was not conducted in every Spanish region.
Illiterate is defined as the inability to read. The censuses also recorded the number of people who know how to read but not write. These people, who were consistently a small minority, I have classified as literate.
Our World in Data does not seem to have adjusted for this when comparing historical literacy rates across European countries.
Map with pointing arrows:
Unusually, the capital of Pontevedra province (city of Pontevedra) was not its largest city (still isn’t). That would be the city of Vigo. Regardless, the share of the provincial population living in the main city is very low, whether measured using Pontevedra (1.53%) or Vigo (2.52%).
All main cities correspond to present-day Spanish municipalities, with one exception: Bilbao, the capital of Gipuzkoa province in the Basque Country. Bilbao’s 1860 illiteracy rate includes the former municipalities of Deusto and Begoña, which were later absorbed into the city. Excluding them would lower the Basque Country’s urban illiteracy rate from 47.2% to 44.8%. Another challenge was the province of the Canaries, which today consist of two separate provinces. Luckily, both capitals had almost the same population in 1860 (14,000 people) and very similar illiteracy rates (71.4% vs 72.6%).
Among Andalusian cities, the correlation coefficient between population size and illiteracy rate is r = -0.56. Larger cities had less illiteracy.
Those cities are: Cádiz, Sevilla, Madrid, Málaga, Barcelona, Valencia, Zaragoza, Granada, Murcia.
Local languages were also spoken in other regions (Basque Country, Balearic Islands, parts of Aragón), but their use was far more limited.
“There’s also the issue of the large-scale internal migrations that have taken place in Spain over the past century and a half. The population of 2015 Madrid was not primarily descended from the people who lived in Madrid in 1860 or 1877, but as long as I exclude Madrid and maybe Catalonia - the two main destinations of Spanish internal migrations - I can confidently compare regions such as the Canary Islands or Galicia in the late 19th century with the same regions in 2015.”
I think a fair comparison is still not really possible given Murcia, Extremadura and Andalucia sent a lot of people to other regions either brain-draining them or more fairly also send their least desirable members to Cataluña and Madrid which would have maybe seen a lowering given this (but you exclude them already).