
Northern Indians do humanities while Southern Indians do tech? Part two
A look at the stereotypes of Indian students. Part two.

This is the second part of my analysis of the data used to support the idea that Northern Indian students have a very strong preference for humanities courses (and maybe dislike for tech courses) and Southern Indian students have a very strong preference for tech courses (and maybe dislike for humanities courses), and the reasons why this might be so.
In that previous post I reached the conclusion that there’s definitely some truth to the idea that Northern Indian students prefer humanities courses and Southern Indian students prefer tech courses but with a much smaller gap than stated in the original tweet that prompted me to do this analysis. But more significantly, there’s a lot to be learned by probing the different explanations given by the hundreds of Twitter users who replied to that tweet. These are the four major groups of explanations that I identified from those replies as I’ve already stated in the previous post:
People in the North just want to get a government job or even be politicians, and a humanities diploma is required for a government job.
There’s a correlation between high enrollment in humanities and lower income level, and that probably means causation in one direction or another. Specially in relation to Uttar Pradesh and Bihar, both states with a very high percentage of students in the humanities according to those tweets, while at the same time being the two poorest states of India in per capita terms.
It’s the result of social pressure in the South. And family pressure. Humanities are looked down upon in the South.
It’s just the effect of engineering colleges in the South having many students from the North. There are just more engineering colleges in the South.
In my first post I already explored the validity of groups one and two drawing from the same survey data that was used to create the map in the original tweet. So now it’s time for me to look into the validity of group four.
This is a good example of the fourth group of explanations.
The poster here is implicitly making two assumptions:
The source data is only educational status and so we just have the number of students along with some characteristics (course enrolled, maybe age, maybe type of institution) in each Indian State.
There is no data that will allow us to figure out if a student enrolled in state X actually comes from state Y.
Those assumptions are wrong because the Household Social Consumption survey is focused on demographic data (social group, language, etc…) and social indicators in general for Indian households. Education data, grouped by household, is just one aspect of the survey.
A student studying in state X is considered enrolled in state X if she is part of a household located in state X, and this gives us a good way to estimate the number of students who come from a different state to study in state X. We just have to look for one-person households (just the student) where that person is currently studying and the language at home is different than the languages spoken in state X.
A real example of this, taken from the survey data, is a 20-year-old male engineering student currently living in Karnataka whose language is Hindi. Or a 19-year-old female science student currently living in Andhra Pradesh whose language is Bengali.
A problem with this approach is that even though most states in India have a dominant language they are no completely monolingual, especially when it comes to border areas where people might speak the language that is dominant in a neighbouring state. This can be solved by only including cases where students speak the language of a non-bordering state, say Hindi-speaking students in Telangana or Bengali-speaking students in Karnataka.
The problem with that approach is that the survey sample is too small. Only 513,000 people corresponding to 113,757 Indian households are surveyed out of a total population of more than 1,400 million. And so the cases I’m looking for are just too few to make a proper estimate (i.e. only two Bengali-speaking students in the whole of Southern India). Are there too few cases in the survey sample simply because there are too few cases in general?
I decided to check another variable in the survey data. This time it’s the value for distance (kilometers) of educational institution from place of residence. If some of those students are being counted as part of the household of their state of origin, state Y in place of state X, then they should declare that they are studying very far from their household. This isn’t a very precise measure because “very far” in this case is just 5 kilometers (3.1 US miles) or more, so it will include many cases of people studying in their own state, but it should give us another perspective on this issue.
It turns out that 49% of students enrolled in diploma, graduate and post graduate courses study 5 kilometers or more from their residence in Bihar, and 66% in Uttar Pradesh. For comparison, the same figure for Southern Indian States varies between 74% and 85%. It doesn’t look like Northern Indian students tend to study outside their original states at first sight.
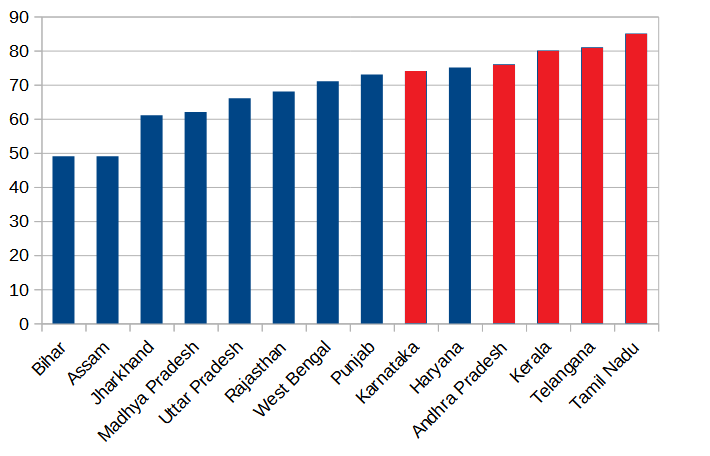
But maybe it’s just engineering students? The figure just for engineering students from Bihar is 56%, and for Uttar Pradesh is 75%. Again, those figures are low compared with Southern Indian states where it varies between 77% and 90%. The only big Northern states in that range are Haryana (80%) and West Bengal (82%). There is no indication judging by this survey value that engineering students from the North are studying in the South.
Erstwhile students
Even though it already seems like engineering students from the North are not studying in the South I wanted to make sure by trying another approach. As I mentioned in the previous post the survey data is divided into several blocks, and one of those blocks corresponds to erstwhile household members currently studying. This sounds exactly like what I’m interested in, people studying away from home in another state of India, except for one little problem: this block doesn’t include information about the subject area of the course a person is enrolled in, making it impossible to just focus on engineering students.
Nevertheless, limited information is better than no information, and so I decided to look at the data in this block. These are the percentages of students enrolled in diploma, graduate and post graduate courses currently studying outside of their home state for the five Southern Indian states and all “big” Northern Indian states.
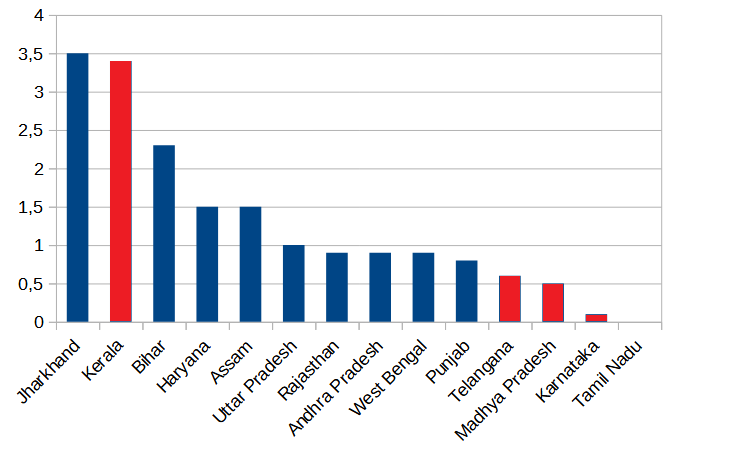
Southern states are coloured in red, and as you can see they do have lower rates of students enrolled outside their home state, Kerala being an exception. But the absolute values of those rates are all low. Jharkhand has the highest rate with only 3.5%, and that is counting students currently enrolled in any other state, not just Southern states.
If I restrict the previous estimation to just students from Northern states enrolled in Southern states this is what I get.
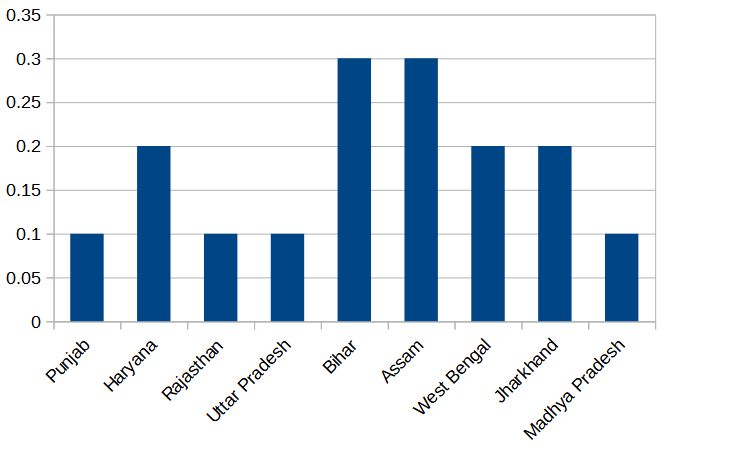
Now the highest rate is just 0.3%. Whatever the rates for engineering students are I’m willing to bet they’re not very different from these rates.
My impression after looking at all these data is that explanation number four is probably wrong.
To sum up, after what I’ve shown here and in the previous post, if I had to give an explanation for what is the reason why some Northern Indian states (especially Bihar, Uttar Pradesh, Jharkhand, Assam) have a high student enrollment in the humanities and a low enrollment in STEM this would be it:
People in some Northern Indian states have a large preference for enrolling in humanities studies to the detriment of STEM studies as a way to try to secure a job in an economic environment of high unemployment, and I see no clear evidence of a lack of institutions for those who prefer to study STEM or of a brain drain from those states.
Take this with a grain of salt. Like everything I analyze in this Substack (is it a blog?) I try to be as accurate in my assessments as the data will allow me but I’m far from being right all the time.
I hope you enjoyed this two part article, and if you did please subscribe.