
Northern Indians do humanities while Southern Indians do tech. Or do they?
A look at the stereotypes of Indian students

A few days ago I saw this in twitter:

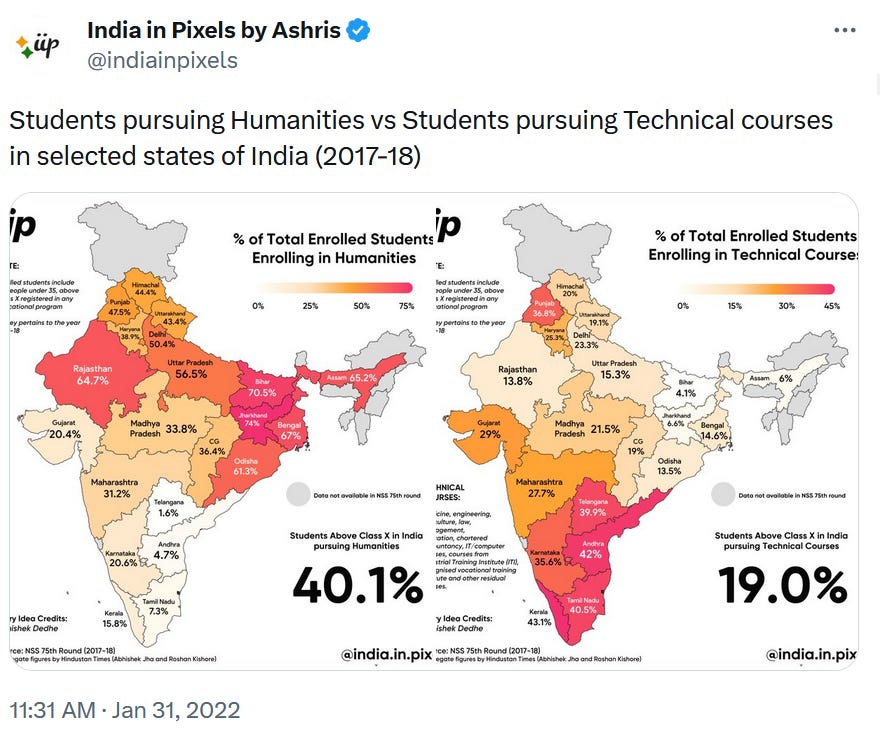
Which was a retweet of this original tweet from January 2022 by the user India in Pixels, showing a map of India with stark differences in the percentage of students enrolled in the humanities between Indian states, some states having more then 50% enrollment while others have less than 5%.
Browsing through the replies to those tweets I noticed that many of them attempted to explain those differences, and the majority of those explanations fell within these groups:
People in the North just want to get a government job or even be politicians, and a humanities diploma is required for a government job.
There’s a correlation between high enrollment in humanities and lower income level, and that probably means causation in one direction or another. Specially in relation to Uttar Pradesh and Bihar, both states with a very high percentage of students in the humanities according to those tweets, while at the same time being the two poorest states of India in per capita terms.
It’s the result of social pressure in the South. And family pressure. Humanities are looked down upon in the South.
It’s just the effect of engineering colleges in the South having many students from the North. There are just more engineering colleges in the South.
Not being Indian and therefore not having much context, my reply to that tweet was:

In fact, I thought that 1.6% for Telangana was so incredibly low compared to states like Jharkhand and Bihar that it might be worthwhile to take a look at the data used to support the idea that Northern Indians prefer the humanities while Southern Indians concentrate on technology studies and try to weigh the validity of the explanations offered in those reply tweets.
But before I dive into the data, let me add that the original post by India in Pixels provides a much more nuanced analysis of the graph and in fact is part of a thread with a whole set of graphs, not just for students enrolled in humanities but also technical courses, science, commerce. My intention was to take a look not just at enrollment in the humanities but also in other areas in order to better understand the context of these enrollment figures.
What’s the source for the data that was used to produce those maps and how did I get my hands on it ?
The education enrollment data for India comes from the National Sample Survey site from the Indian Ministry of Statistics and Programme Implementation. I downloaded the Household Social Consumption: Education, NSS 75th Round Schedule-25.2 :July 2017-June 2018 which is the same data mentioned as the source for the original tweet, and took a look at it myself. The households participating in the survey were randomly selected based on a sampling procedure. There were a few extra steps involved before I could actually work with the data (install the Nesstar data browsing program, export) but I won’t bore you with the details.
Also, the survey is divided into several blocks with each block focusing on a particular aspect of households. The block I mostly used for this analysis is the one concerned with education, consisting of persons between the ages of 3 and 35 who were studying at the time of the survey.
But before digging into the survey data I took a look at a few very large households in order to get a better understanding of the data before doing any analysis.
Here’s the first such household with 14 persons between the ages of 3 and 35 who are studying some course.
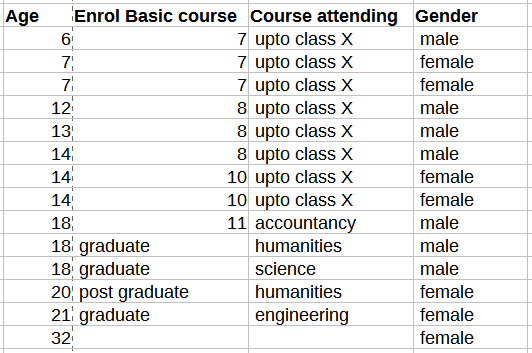
As you can see most students fall into the upto class X category for Course attending, which is to be expected given that 97% of Indian children between 3 and 15 years old are enrolled in those classes. And I should mention that the Course attending and Enrol basic course fields of this database are the ones that I’ll be focusing on during this whole analysis because they are the ones that answer the questions “how many students are enrolled in the humanities?“ and “how many students are pursuing humanities degrees?“
Let’s check another very large household now.

You can see there that humanities as a Course attending value can be a graduate course or a higher secondary course. In fact students attending a humanities course are for the most part enrolled in a graduate or higher secondary course (92%) but they can be enrolled in any of these courses:
Secondary
Higher secondary (49%)
Diploma /certificate course (upto secondary)
Diploma /certificate course (higher secondary)
Diploma /certificate course (graduation and above)
Graduate (43%)
Post-graduate and above (7%)
And that makes me wonder if most students pursuing courses in the humanities are actually in higher secondary (grades or classes 11 and 12) courses, not in tertiary education or pursuing a diploma. In order to understand what is it that high secondary education students are engaged in I graphed the values for Course attending for all students enrolled in higher secondary education.

That graph reflects the fact that there are three core streams for higher secondary students to take in India: Humanities, Science and Commerce. And if I understand the university entry system in India correctly, the fact that a student chose a particular core stream does not preclude studying subjects related to another core stream or obtaining a diploma related to another core stream.
So including students in higher secondary education who chose the humanities stream in “students enrolled in the humanities“ category does not make sense. Not if you are interested in what course enrollment means in terms of the Indian job market in general, government jobs in particular, economic development of India, and the science and research output of India.
For what is worth, Bihar has a 59% higher secondary enrollment in humanities and Telangana has a 5% enrollment in the same stream. And yet when it comes to diploma, graduate and post-graduate enrollment only 30% of students in Bihar choose the humanities and only 1.3% of students in Telangana choose the humanities.
That 1.3% is pretty close to the 1.6% reported in the original tweet (maybe the 1.6% includes law), but the 30% for Bihar is far from the 70.5% reported. In fact I made a table of enrollment in the humanities for diploma, graduate and post-graduate courses considering 29 Indian states and union territories, and it shows much less of a difference between the North and the South of India than what the original tweet reported.

Compared to the original figures the percentages in this table exhibit some important differences:
There is no state where a majority of students are enrolled in the humanities.
There’s still a clear difference between enrollment in the North and the South although a much smaller one. And the area of India with the highest enrollment in humanities doesn’t seem to be just the North in general but the Northeast in particular.
Jharkhand and Bihar are not the states with the highest enrollment in the humanities. The three states with the highest enrollment are all in the Northeast of India, including Assam. And even if we ignore Arunachal Pradesh, Tripura and Meghalaya because they were not considered in the original tweet, Jharkhand goes down to second place and Bihar goes down to third place tied with Rajasthan.
The geographic divide between North and South is not so clear anymore, with Goa and Gujarat having a 4% enrollment in the humanities which is in the same range as the Southern states.
Still, the percentages for enrollment in the humanities for the states with the highest enrollment (Northeast India) seem to be around 25 to 30 times greater than the percentages for the states with the lowest enrollment (Andhra Pradesh and Telangana). And 20 to 25 times greater for Bihar and Uttar Pradesh.
Is this the whole story?
Relative to what
The percentages of students enrolled in diploma, graduate and post-graduate humanities courses still seem very high for several states. However, these percentages are relative to the total enrollment in any diploma, graduate, or post-graduate course.
If 40% of enrolled students are studying humanities out of a total student body that represents only 1% of the population of studying age, say 17 to 26 years, it would be inaccurate to claim an 'excess' of humanities students. Instead, I would say there’s too few people studying for any kind of degree across all areas.
This lead me to the question: what is the percentage of the population between the ages of 17 and 26 enrolled in diploma, graduate and post-graduate humanities courses in relation to the total population within that age group?
I chose the age bracket of 17 to 26 years old because 95% of all students currently enrolled in diploma, graduate and post-graduate studies belong to that age bracket. Here’s the answer:

As can be seen in the previous table Bihar and Uttar Pradesh are now in the 10th and 14th position for highest enrollment of students in the humanities respectively. And now their percentages are just 10 to 12 times greater than the percentages for the states with the lowest enrollment, Andhra Pradesh and Telangana.
There’s still a clear difference between North India and South India but more nuanced than what it seemed before. There are two areas with high enrollment in the humanities now, Northeast India as we saw before, and the extreme North of India: Jammu & Kashmir, Himachal Pradesh and maybe Uttarakhand. Also Delhi and Rajasthan have high enrollment but in the case of Delhi I think it’s safe to assume that being the capital of India it makes a lot of sense for Delhi to have a lot of demand for humanities degrees.
Now would be a good time to take another look at the idea that there’s a correlation between humanities high enrollment and lower income level for Indian states, and for that I graphed the percentage of enrollment in humanities against income per capita (USD PPP) for all the 29 states and territories that I’ve been working with.

I also added a red line eyeballing the tendency that I see in that graph and which matches the correlation value between enrollment and income per capita calculated for those 29 states and territories: -0.32. That is a low but not insignificant correlation, and it doesn’t say by itself what direction the correlation goes. Is it really the case that humanities high enrollment has a (mild) negative effect in the level of income, or maybe it’s just the fact that poverty and few job opportunities motivate people to study anything that might get them a job?
Humanities as a job ticket
In order to cast some light on that last question I calculated the same correlation for all the values of Course attending in the survey.

Some of those correlations seem consistent with the view the STEM studies in general are needed for economic growth but some of them don’t. First, the best correlations are for commerce, management and medicine, none of which I would consider part of STEM.
Second, at least one STEM subject, science, has a small negative correlation with income per capita while the other two, IT/computer and engineering, have a low and medium positive correlation respectively.
But what especially caught my attention is that education has a negative correlation very close to the negative correlation of the humanities.
That seems to lend support to the idea that studying humanities courses is for a lot of people in India a way to get a government job, and education seems like a second best option. This is also supported by the fact that the correlation between male enrollment in education courses and income per capita is a negative -0.38, even stronger that the correlation for all enrollment (male and female).
I hope this post has shed at least some light on this subject, particularly on the validity of the first and second group of tweet replies mentioned earlier. I intend to follow up in the next few days with a few data backed observations on group number four of tweet replies (“engineering colleges in the South having many students from the North“) and maybe a few more observations drawn out from the survey, which is really a treasure trove of information on India. [Edit: here’s the follow-up]
Thanks for reading this far, and if you found this post interesting please consider subscribing.
Spectacular data-journalism work that is, moreover, presented in simple words, adding value to the initial statement. Respect.