

According to estimates done by geographer José Antonio Villaseñor y Sánchez in 1742-1744, the population of what would eventually become Mexico was approximately 3.86 million souls at the time1.
Half a century later, in 1790-1793, a proper census was conducted during the rule of viceroy Juan Vicente de Güemes, Count of Revillagigedo, and arrived at a total population of 4.53 million. If we take these numbers at face value, Mexico’s population grew slowly but surely during the second half of the 18th century. Moreover, if we accept Gonzalo Aguirre Beltrán’s estimate of around 2 million for the early 1700s2 (which I think is too low), then Mexico’s population more than doubled over the course of the 18th century.
This might seem like a very large population increase by the standards of the Old World, but it was not unusual among the future Latin American nations. Brazil, aided by a massive wave of migration, increased its population almost tenfold between 1700 and 1800. Cuba, another colony characterized by high immigration and a small Indigenous population, grew around 6X-8X over the same period. At the other extreme, Peru’s population, which was overwhelmingly Indigenous, appears not to have grown during the 18th century and may even have decreased.
The pattern of slower natural growth - births minus deaths - in populations with a larger Indigenous share, and faster growth in those with a smaller share should not surprise us, given the demographic catastrophe that American Indigenous peoples suffered beginning immediately after contact with Europeans and lasting for several generations. How many generations exactly? Well, that depends on the country and the expert you ask, with most estimates placing the low point of the Indigenous population somewhere between 1650 and 1750.
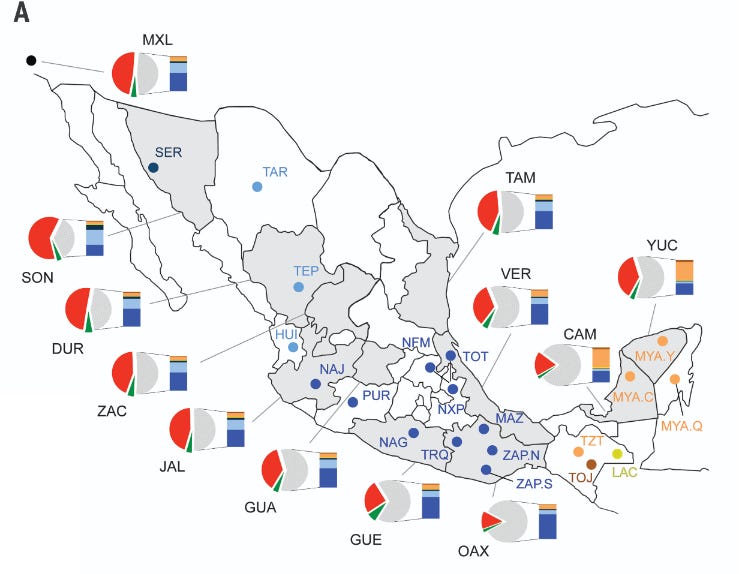
Fortunately, we not only have the overall Mexico figures for 1742 and 1790, but also population breakdowns by jurisdiction for some regions, including regions with a high Indigenous share (e.g. Oaxaca) and regions with a lower share, such as Durango and Sinaloa. I have marked some of these regions on the following map of current American Indigenous ancestry share, based on Fuerst and Kirkegaard (2016).
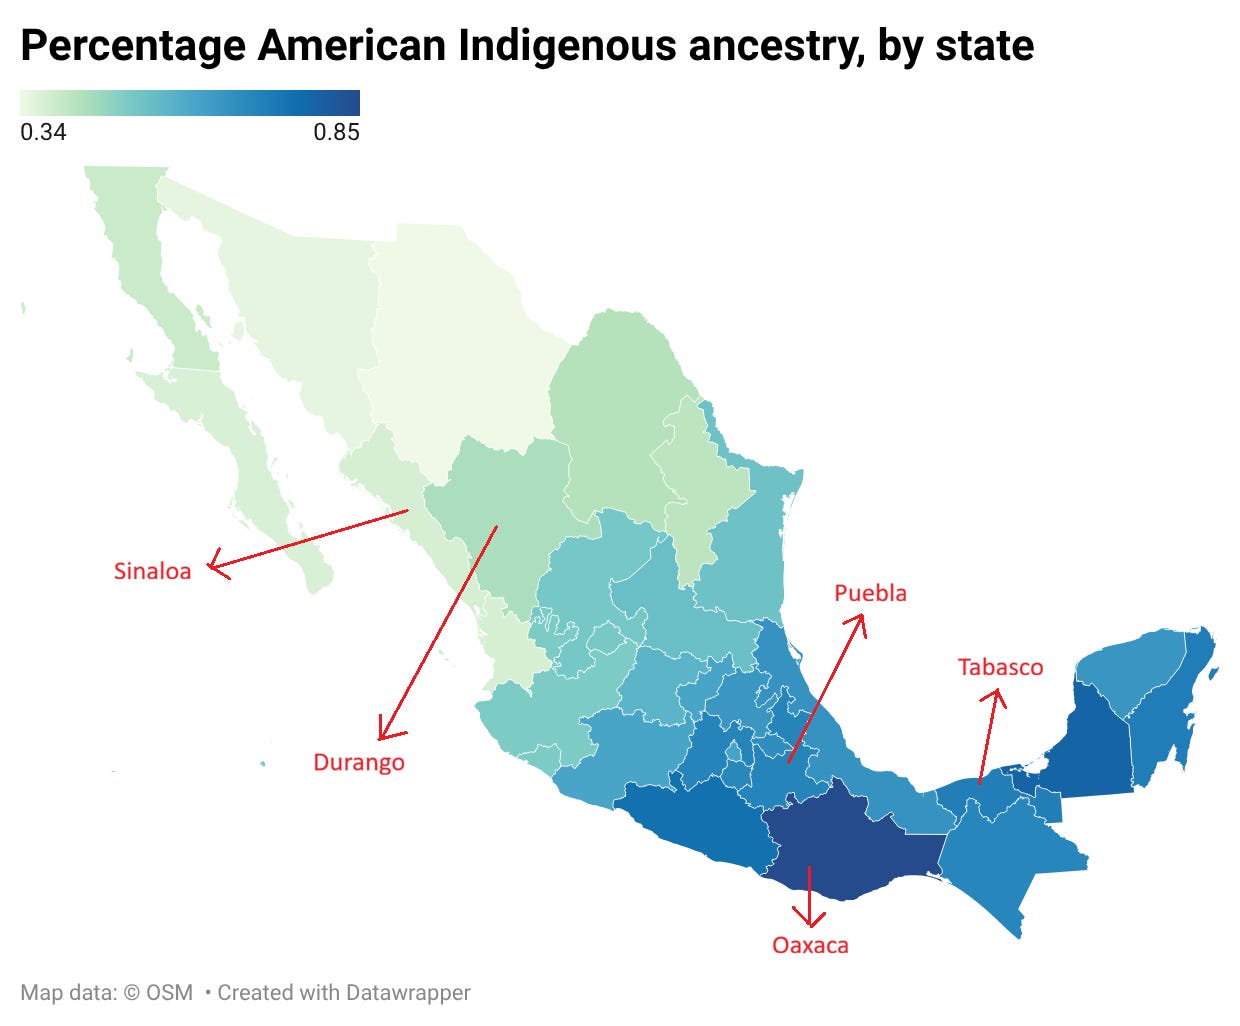
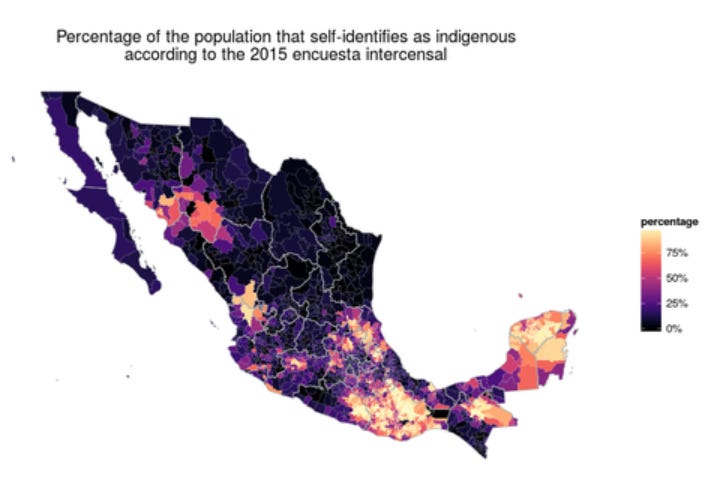
The geographic patterns that you can see on the map - higher share of Indigenous ancestry in the south and southeast, and lower share towards the north - are corroborated by other sources3 and roughly match the geographic distribution of people who identified as Indigenous in 2015.
And they also look rather similar to the Indigenous shares of population reported or estimated4 in the 1790 census (notice that Mexico’s internal borders in 1790 do not always match current internal borders and there isn’t data for every state).
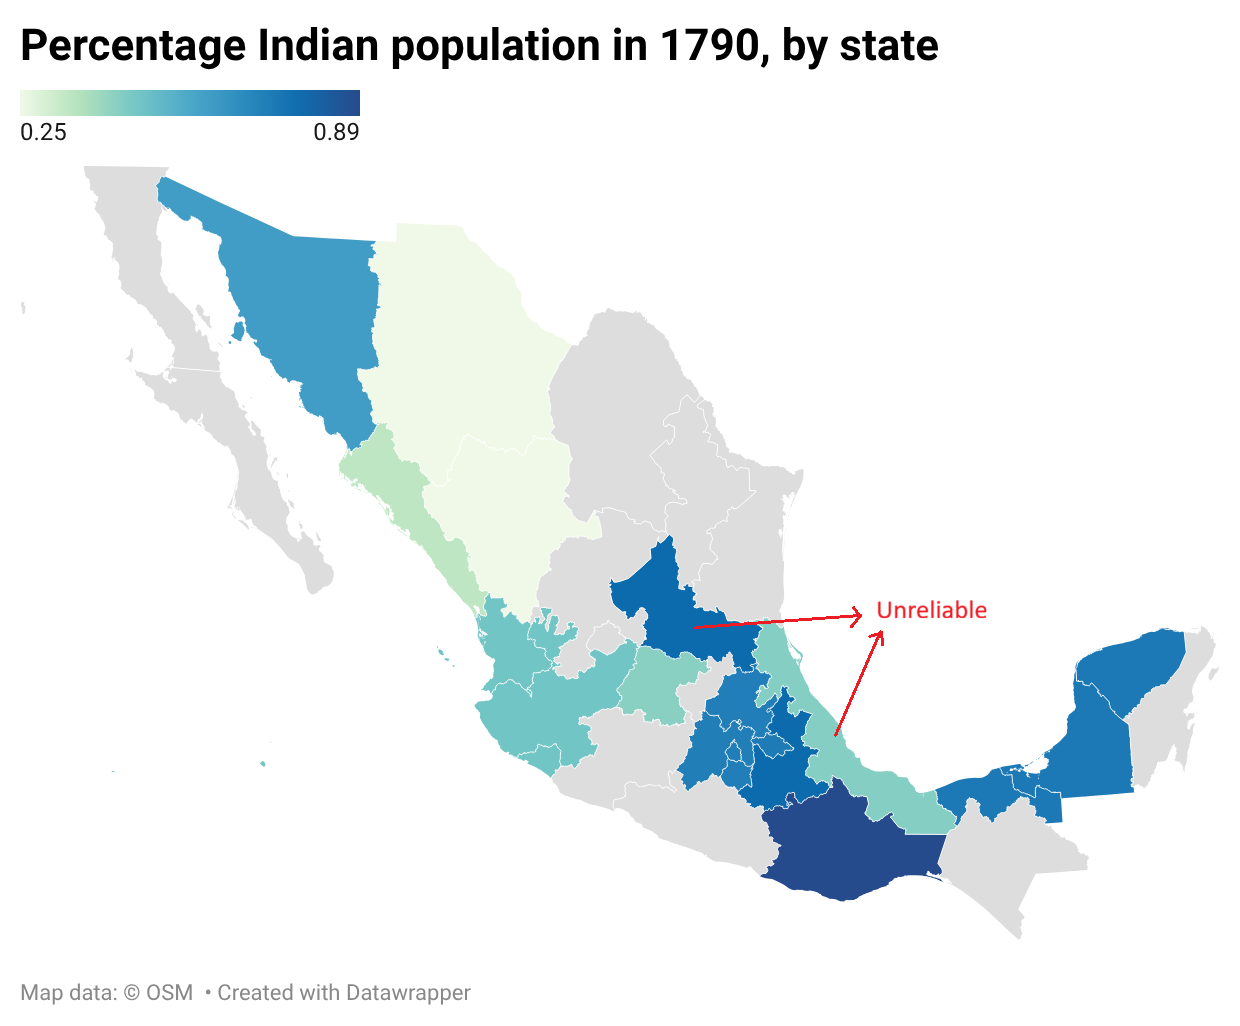
Despite the less than perfect accuracy of these maps, the unreliability of the self-reported 2015 data, and the effect of recent internal migration on the geographic distribution of the Indigenous population, there is a clear continuity between the distribution during colonial times and that of today. Regions such as Oaxaca state and the Yucatán peninsula have had a high Indigenous share since the time of Hernán Cortés, while northern states like Sinaloa and Durango have long had a relatively low share of Indigenous ancestry.
This begs the question of whether the populations of Mexico’s regions (intendancies during colonial times, states after independence) followed the same pattern we’ve seen in the rest of Latin American, where less Indigenous countries grew faster and more Indigenous ones grew more slowly, or not at all.
The Mexican geographer Hugo Castro Aranda has helpfully compiled the data that may allow us to answer this question, at least for some jurisdictions in some regions between 1742 and 1790, in his work 1er censo de población de la nueva España. 1790: Censo de Revillagigedo “un censo condenado”5. By comparing the 1742 and 1790 population figures we can estimate annual growth rates of 0.42% for Tabasco, 0.93% for Puebla, and 0.40% for Oaxaca6, all heavily Indigenous regions. If we take Charles Gibson’s Indigenous population figures for the Valley of Mexico at face value, we can add his estimated rate of 0.45% to that list7.
Despite Puebla’s higher rate, it’s hard not to notice that annual growth rates seem to cluster in the 0.40%-0.45% range, or about 21%-24% compounded growth over 50 years.
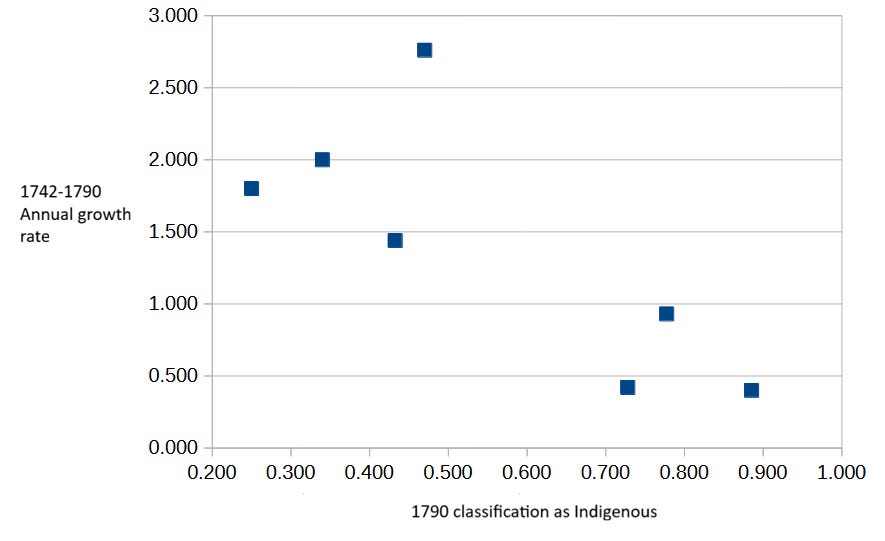
These rates contrast sharply with the annual growth rates of regions with a lower Indigenous share like Durango, Sinaloa, Jalisco and Guanajuato8, which range between 1.44% and 2.76%, as you can see in the following chart.
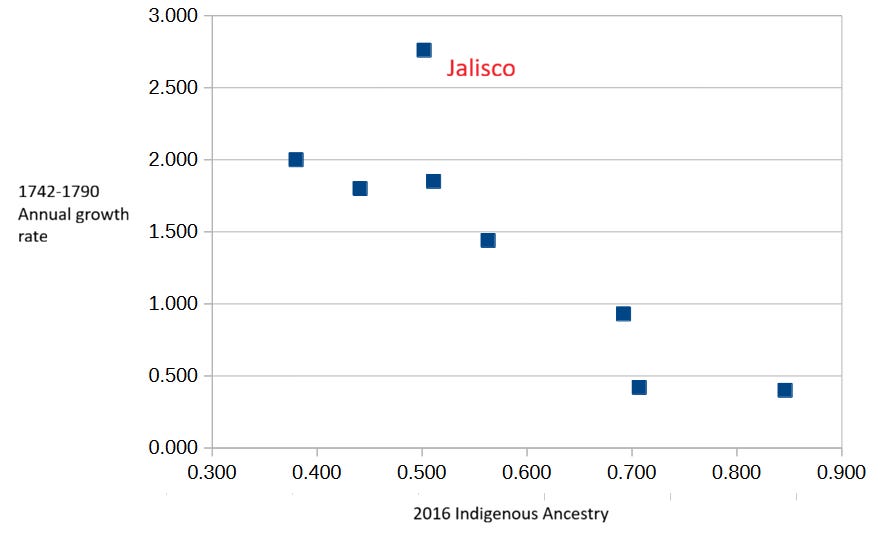
The chart suggests a strong correlation between the modern share of Indigenous ancestry in each Mexican region9 and the growth its population experienced, just like we saw for Latin America as a whole.
In fact, despite the obvious limitations of Indigenous ancestry as a predictor of population growth - the most salient being the distorting effect of internal migration - the correlation coefficient (Pearson’s r) between Indigenous ancestry and annual growth rate is a very high -0.84. Using the Indigenous share reported in the 1790 census instead of 2016 Indigenous ancestry as the predictor variable does not change the general result (see chart here10), even though the correlation is slightly weaker: -0.77.
Notice that the 1790 Indigenous share is not a measure of overall Indigenous ancestry. If a state’s population was classified as 50% Indigenous in 1790 and has around 50% Indigenous ancestry now (Jalisco is close to this), this implies its Indigenous ancestry has fallen significantly. A simple model in which the entire 1790 non-Indigenous population was Mestizo - let’s assume roughly half Indigenous and half European - would put the overall population at about 75% Indigenous in 1790 and only 50% today.
This post-1790 fall in Indigenous ancestry fits the estimated growth rates of Mexican states during the 1790-1895 period (the first general census of independent Mexico took place in 1895), where again we can see that the higher a state’s Indigenous ancestry, the lower its growth rate.
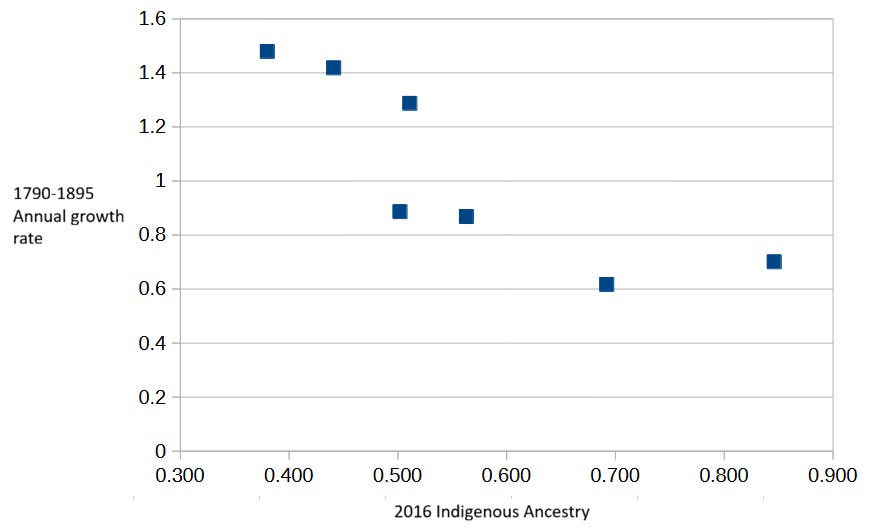
If we assume that Indigenous communities in states with a low share of Indigenous population grew at a similar rate as the general populations of heavily Indigenous states (therefore substantially more slowly than their Mestizo neighbors), then Indigenous ancestry in the northern states must have declined significantly not only before 1790, but also afterwards.
A similar phenomenon must have happened in the central Mexican states with a relatively higher Indigenous share, such as Guanajuato and Jalisco. As we saw earlier, average Indigenous ancestry in these states’ populations may have decreased from something like 75% to around 50%.
And finally, in the heavily Indigenous southern regions (e.g. Oaxaca, Puebla), the very different growth rates of Mestizo and Indigenous groups may not have greatly changed local ancestry profiles, but they did decisively reduce the relative weight of southern regions within Mexico’s population.
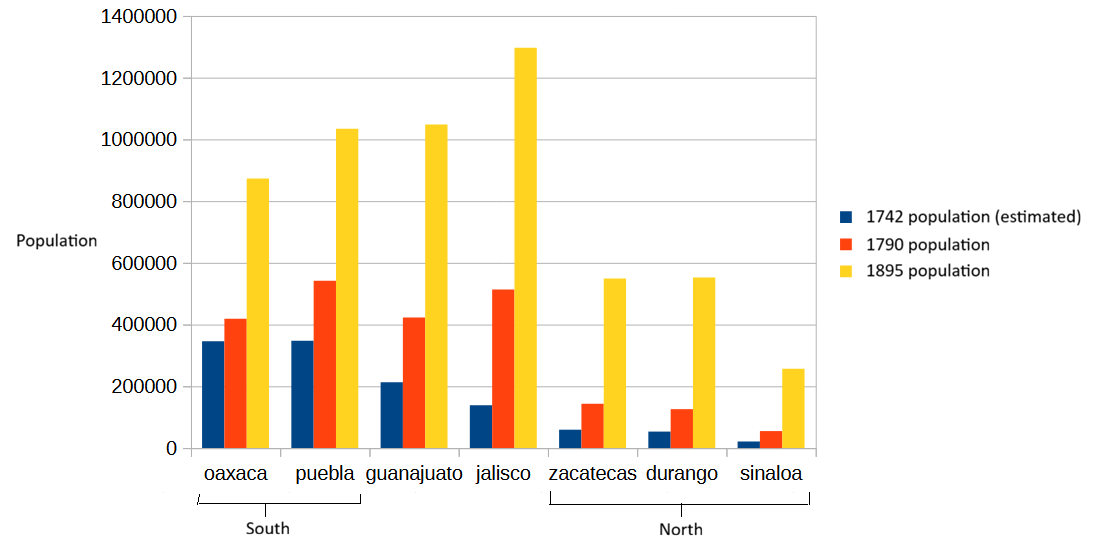
Differential growth between groups can produce strong changes in a population’s composition over long periods of time. As I mentioned before, an annual growth rate of 0.40%-0.45% raises total population by only 21%-24% in half a century, while higher growth rates of 1.44%-2.0% can raise it by 100%-160% over the same period. What may seem like a small gap between rates becomes a large compounded difference in the long run.
The following pie chart illustrates this compositional change not between Indigenous and Mestizo groups, but between heavily Indigenous southern regions and heavily Mestizo northern regions, although only for the regions I’ve discussed so far.
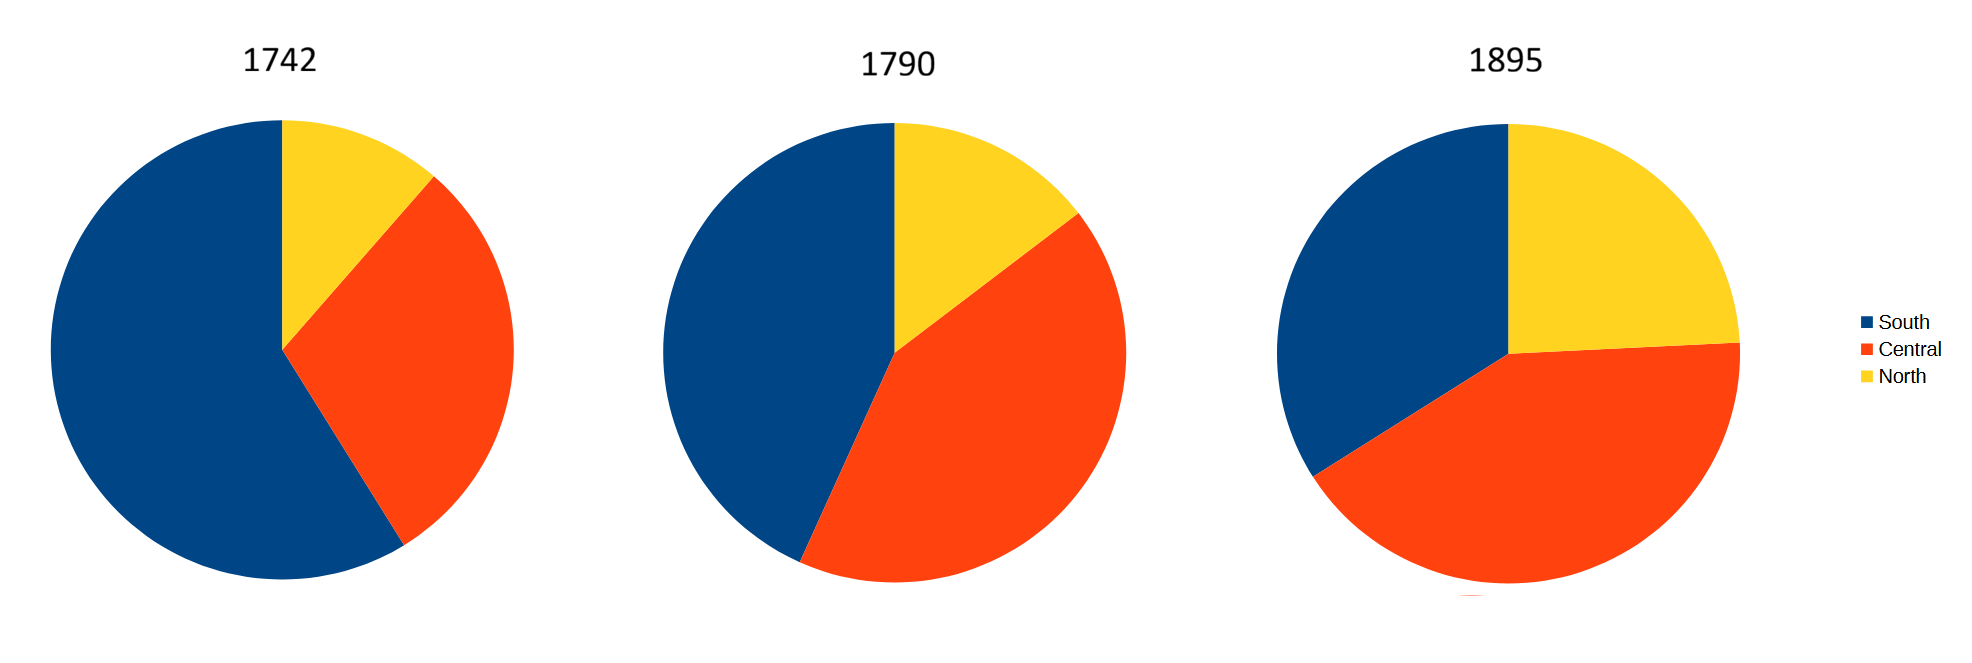
It is undeniable that the distribution of Mexico’s population among North, South, and Center changed substantially in the 18th and 19th centuries. Moreover, it is almost certain that the balance between Indigenous and non-Indigenous population changed even more dramatically.
Given that Mexico’s non-Indigenous population was overwhelmingly Mestizo, it may seem surprising that it grew so much during colonial times. If the main reason for the Indigenous collapse and later slow recovery was biological - being immunologically naive to the many diseases introduced from Europe - then Mexico’s Mestizo population, which is partly Indigenous, should have been at least partly immunologically naive as well, right?
It would then follow that Mestizos should have had higher mortality than Europeans during the 18th and 19th centuries (and more so earlier). Their rate of natural growth - births minus deaths - should therefore not have been very high.
Well, as impressive as a rate of 100%-160% increase over fifty years may sound, it is a relatively low increase when compared to the hypothetical maximum growth for a population that was not immunologically naive. We know this because the existence of such as a population is not hypothetical.
How fast is fast?
The Dutch Cape Colony, which would eventually become Cape Town, was founded by the Dutch East India Company (VOC) in 1652 near the southern tip of Africa. Given the VOC’s aim of using the colony simply as a provisioning point for trade expeditions on their way to Asia, it’s not surprising that the Company put little effort into promoting migration to the Cape, and very few - less than two thousand11 - mostly Dutch, French and German colonists settled and left descendants there.


When the VOC’s shareholders authorized the founding of an African outpost, they probably did not imagine it would become a sort of natural demographic experiment. Helped by novel social norms adapted to their new environment12 and by access to plentiful land - though not always acquired peacefully or fairly - the number of colonists, who eventually became known as Boers and then Afrikaners, grew extraordinarily fast.
The Afrikaner community today numbers around 2.8-3.5 million people, more than a thousand times its late-17th century founding population. Some of this huge growth can be attributed to immigration, but the overwhelming majority of modern Afrikaner ancestry comes from early settlers who arrived before 170613, when the VOC ended subsidized immigration to the colony.
Afrikaners married young, had many children, and did not experience the high mortality typical of immunologically naive populations. Thus, they achieved one of the highest natural growth rates recorded for the 18th and 19th centuries: around 2.6%-3.0% pear year14.
Going back to the American continent, at the same time that Mexico’s Mestizo population was growing fast and the Afrikaner community was growing incredibly fast, there was another population group of European origin in North America which was also characterized by early marriages and large families.
The founding population of the French Canadian community was larger than that of the Afrikaners - on the order of 5,000 to 10,00015 - but despite different starting points the two communities followed similar growth trends. Also, just like the Cape Colony, New France received little further immigration after its formative years in the mid-17th century, allowing us to estimate its natural growth rate with some precision. And this rate was similar to the Afrikaner one, around 2.5% to 3.5% per year, through the 18th and 19th centuries.
So now we have two clear examples of populations with access to ample land and resources, and neither of them was immunologically naive. And both clearly grew at a faster rate than the heavily Mestizo regions of northern Mexico in the 18th and 19th century, except for Jalisco (2.77%).
Leaving Jalisco aside for now, the cumulative effect of fifty years of growth at a 1.9% rate - the northern Mexican rate - would be to multiply a population by 2.6X, while the effect of a 2.6% rate on the same initial population would be an increase of roughly 3.6X. Mexico’s Mestizo population was growing very fast relative to its Indigenous population, but still not as fast as some other contemporaneous communities.
I can’t state with certainty whether this gap was due to the Mestizo population being “partly immunologically naive” (it was certainly not due to late marriage), but it seems to me that is the most parsimonious explanation.
And what about Jalisco?
First, let me point out that Jalisco’s very high growth rate (2.77%) is confined to the 1742-1790 period. Later, in the 1790-1895 period, Jalisco’s rate fell into the same range as the other northern states (0.87%-1.48%). It is only an outlier for 1742-1790, as you can see on the first scatter plot of this post.
The colonial territory that would later become the state of Jalisco - the intendancy of Guadalajara - also included the modern states of Nayarit and Colima in its periphery. In 1790 Nayarit16 accounted for a little more than 10% of Jalisco’s population, yet in Castro Aranda’s 1742 and 1790 figures around 80% of Nayarit’s population can be used to estimate the 1742-1790 growth rate17, against only 58% for Jalisco as a whole. In other words, Nayarit (with a growth rate of 3.0%) is oversampled. Until the 1720s Nayarit was a frontier, under constant threat of attack by Cora and Huichol Indigenous communities18. It’s not surprising that, after its pacification, the territory experienced an immigration driven population boom in the mid- and late-1700’s.
This doesn’t entirely explain Jalisco’s high rate, but at least suggests that natural growth - excluding immigration - was lower than 2.77% between 1742 and 179019.
After reaching a low point probably somewhere around 1700-1750, Mexico’s Indigenous population began to grow again, though much more slowly than Mexico’s Mestizo population. Over the 18th and 19th centuries its pace of growth was similar to that experienced by countries of the Old World at the time20: India 1.7X, China 2.9X, France 1.9X, Italy 2.5X, Egypt 2.7X.
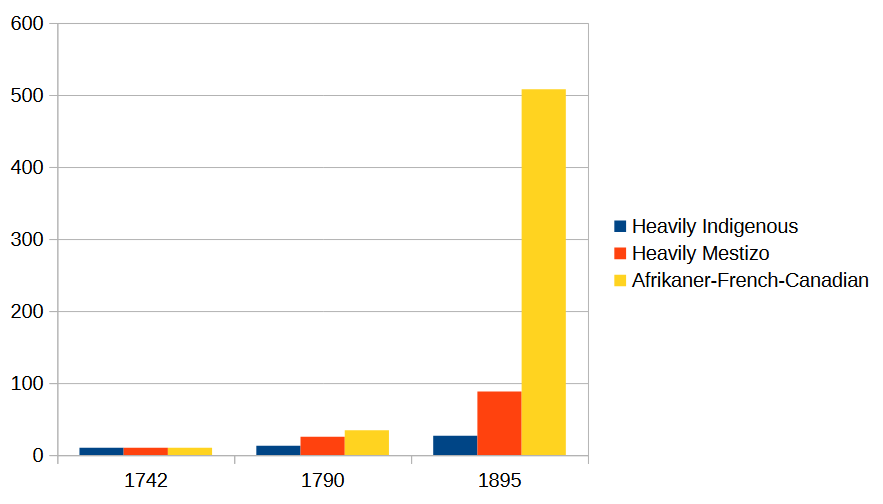
Meanwhile, based on the numbers I’ve presented here, Mexico’s Mestizo population likely grew at least 10X over the same two centuries21. If we think of post-1700 Mexico as a society comprised of two main communities, one Indigenous and one Mestizo (a model we could apply to most of Latin America), what the demographic data shows us is a transformation from a mostly Indigenous country with a Mestizo minority to the mostly Mestizo country it is today.
This may seem obvious. Of course Mexico at the time of the Spanish conquest was an Indigenous land, and the subsequent demographic collapse of the Indigenous population is well known. What I hoped to do with this piece is to outline more clearly how that “replacement” process worked, and especially to show that it was a late-colonial and republican process, not an early colonial one.
I’m setting aside for now certain aspects of this process. Chief among them is the question of why the Spanish community, comprised of those descended mainly from Iberian colonists, did not grow fast enough to transform Mexico into a mostly European country instead of a mostly Mestizo country.
The previous comparison between Afrikaners and French Canadians on one side and Mexican Mestizos on the other implies that if differences in population growth rates were mainly due to differences in susceptibility to disease, this last scenario might have been plausible. Yet, it didn’t happen.
Another aspect I did not treat in depth here is migration. For now, suffice to say that post-1600 Spanish migration to Mexico was relatively low, and after 1700 it had almost no impact on population numbers. Internal migration needs to be taken into account since it could invalidate the assumption that growth in heavily Indigenous regions is a good proxy for Indigenous growth, and growth in heavily Mestizo regions is a good proxy for Mestizo growth. I hope to tackle that in a future post.
So yes, this is actually the first part of what I hope will be a two-part series, which will hopefully serve as the foundation for answering a tweet - since deleted by its author - commenting on a book review which I wasn’t really planning to comment on.
If I understand his methodology correctly, the figure of 3.86 million comes from multiplying the number of households (or families) recorded by Villaseñor by an assumed four persons per family. If instead we assume five persons per family, the mid-18th century population of Mexico might have been around 4.8 million. On the other hand, many of the family counts reported by Villaseñor are clearly rounded, and it’s reasonable to assume that the rounding was mostly upwards.
See The Peopling of Mexico from Origins to Revolution, by Robert McCaa.
See the following map from The genetics of Mexico recapitulates Native American substructure and affects biomedical traits, by Moreno-Estrada et al (2014).
The percentage I estimated for San Luis Potosí comes from one single jurisdiction, Santiago de los Valles. The estimate for Jalisco takes the 17.7% recorded in Guadalajara (its capital) and assumes the gap between the capital and the entire state is similar to those in Guanajuato and Oaxaca (around 30 percentage points). The estimated percentage for Veracruz is calculated similarly as for Jalisco (after excluding non-Spanish Europeans living in the capital). I regard this estimate as less reliable than the one for Jalisco. The shares of Indigenous population in the city of Durango and the district of Mapimí are 22.8% and 23.1%, which suggests that the overall share for Durango state (intendancy at the time) may have been close to 23%. Given that in every state for which we have both a capital and statewide percentage there’s a significant gap between them, I decided to use 25% for Durango.
Published by the predecessor to Mexico’s National Institute of Statistics and Geography (INEGI), the General Directorate of Statistics (Dirección General de Estadística).
The rates I present here are not the ones calculated by Castro (table 84, pages 36-37). For some reason the low rates he presented in “un censo condenado“ are mostly correct, but the higher rates (> 0.6%) are all wrong. Also, I dismissed the population figures for the intendancy of Mérida, excluding Tabasco, for reasons that would take too long to explain here (maybe in a future post on the Caste War).
From The Aztecs Under Spanish Rule: A History of the Indians of the Valley of Mexico, 1519–1810 (table 10), as cited by Hugo Castro Aranda. One reason not to take Gibson’s figures at face value is that people do not like paying taxes, and so Indian subjects may have tried to hide their numbers (with varying degrees of success). Incidentally, Gibson’s figures appear to be one of the main reasons why some historians place the low point of Mexico’s Indigenous population around 1650 (and another reason why I distrust the 1650 date).
Guanajuato today has an average percentage of Indigenous ancestry of 56%, higher than Jalisco’s 50%. Yet in 1790, Guanjuato’s population was recorded as 43% Indigenous and Jalisco’s as 47%, so I treat both states as having similar Indigenous share. Sinaloa’s 1742-1790 growth rate includes Sonora. Its 1790-1895 rate (1.47%) does not. Sonora’s own rate for 1790-1895 is 1.53%.
The regions included are Durango, Guanajuato, Sinaloa, Jalisco, Tabasco, Oaxaca, Puebla and Zacatecas. I excluded the Valley of Mexico because it was one of the main destinations of internal migration in the 20th century, and its 2016 ancestry profile has likely been distorted due to this. I did not include San Luis Potosí either, which recorded a 77% Indigenous population in 1790, because that figure comes from just one jurisdiction (Santiago de los Valles), and the state is 53% Indigenous today. Also, its 1742-1790 annual growth rate was an incredibly high 3.5%, based on only two jurisdictions (1.88% and 5.67%) recorded by Castro Aranda. I don’t regard this rate as reliable.
1790 Indigenous share vs annual growth rate (1742-1790), by Mexican region (excluding Zacatecas):
Maybe even less than one thousand. From Wikipedia: “Between 1688 and 1689, a total of 180 Huguenots from France and 18 Walloons from present-day Belgium settled at the Cape. By 1692, the number of French Huguenots who had settled in the colony reached 201… A 1981 survey found that nine of the 36 most common surnames among white South Africans were of Huguenot origin, including Nel, Du Plessis, Coetzee, Fourie, and Viljoen.“
Including the acceptance of widespread slavery.
Even if we stretch the founding period of the Afrikaner population to its first century and a half, only about two thousand male immigrants arrived in the colony between 1657 and 1806. See Three hundred years of low non-paternity in a human population (2015), by Greeff and Erasmus.
See The ‘White’ population of South Africa in the eighteenth century (1975), by Robert Ross.
See Population at the Canadian Museum of History and Jacques Henripin’s review of Naissance d’une population. Les Français établis au Canada au XVIIe siècle.
Which at the time was called Tepic.
For some jurisdictions we have their 1790 population but not the 1742 figure.
Castro Aranda says: “We wonder whether this rapid [growth] signals the emergence of an immigration region and whether this resulted from - or was caused by - significant changes in the economic structure. It would be worth investigating this remarkable case further; for the moment, at least to us, it defies explanation.“
Old World countries that could colonize abundant new lands, like Russia, experienced faster growth. In the case of Russia, 4X between 1700 and 1900.
8.8X over a century and a half in regions that were heavily, but not exclusively, Mestizo.